Explanation: Understanding ALB Service Metrics and Baseline Monitoring
Introduction
If you've ever been woken up at 3 AM by an alert that turned out to be nothing, you already understand why we built this. Static thresholds like "alert if latency exceeds 500ms" sound reasonable until you realize that your service runs at 480ms during peak hours and 50ms at night. That 500ms threshold is either too sensitive or not sensitive enough depending on when you look at it.
This document explains how we've built a baseline monitoring system that learns what "normal" looks like for each service and alerts based on actual deviations from that behavior. The goal is simple: fewer false positives, faster detection of real problems, and dashboards that actually tell you something useful.
Before we dive in, there's an important caveat to address.
A Note on Why We're Using ALB Logs
We're extracting request rates, status codes, and latency from ALB (Application Load Balancer) logs because most of our applications at W.W. Norton don't expose their own metrics. In a perfect world, each service would have a /metrics endpoint spitting out Prometheus-formatted data about request counts, latency histograms, error rates, and business-specific indicators. That would give us far more accurate and granular visibility.
But we don't live in that world yet. Most of our services were built before observability was a priority, and retrofitting proper metrics instrumentation takes time and coordination across teams.
The ALB sits in front of every service and logs every request. Those logs contain timestamps, response times, status codes, and byte counts. By processing those logs through Loki and generating Prometheus metrics via recording rules, we can get reasonable visibility into service health without touching application code.
This approach has limitations:
- We only see what the ALB sees — if your service makes downstream calls to databases or other APIs, those latencies are bundled into the overall response time
- We can't distinguish between different operations within a service
- Business metrics (like "orders processed" or "users authenticated") are invisible to us
- The data arrives in batches, not real-time (more on this later)
The long-term fix is to enforce proper metrics instrumentation in our applications. If you're building a new service or refactoring an existing one, please expose Prometheus metrics natively. It's worth the investment. The platform team can help you get started with libraries and patterns. Until then, this ALB-based approach gives us something to work with.
How Data Flows Through the System
Let's trace a request from the moment it hits the load balancer to when it shows up in a dashboard.
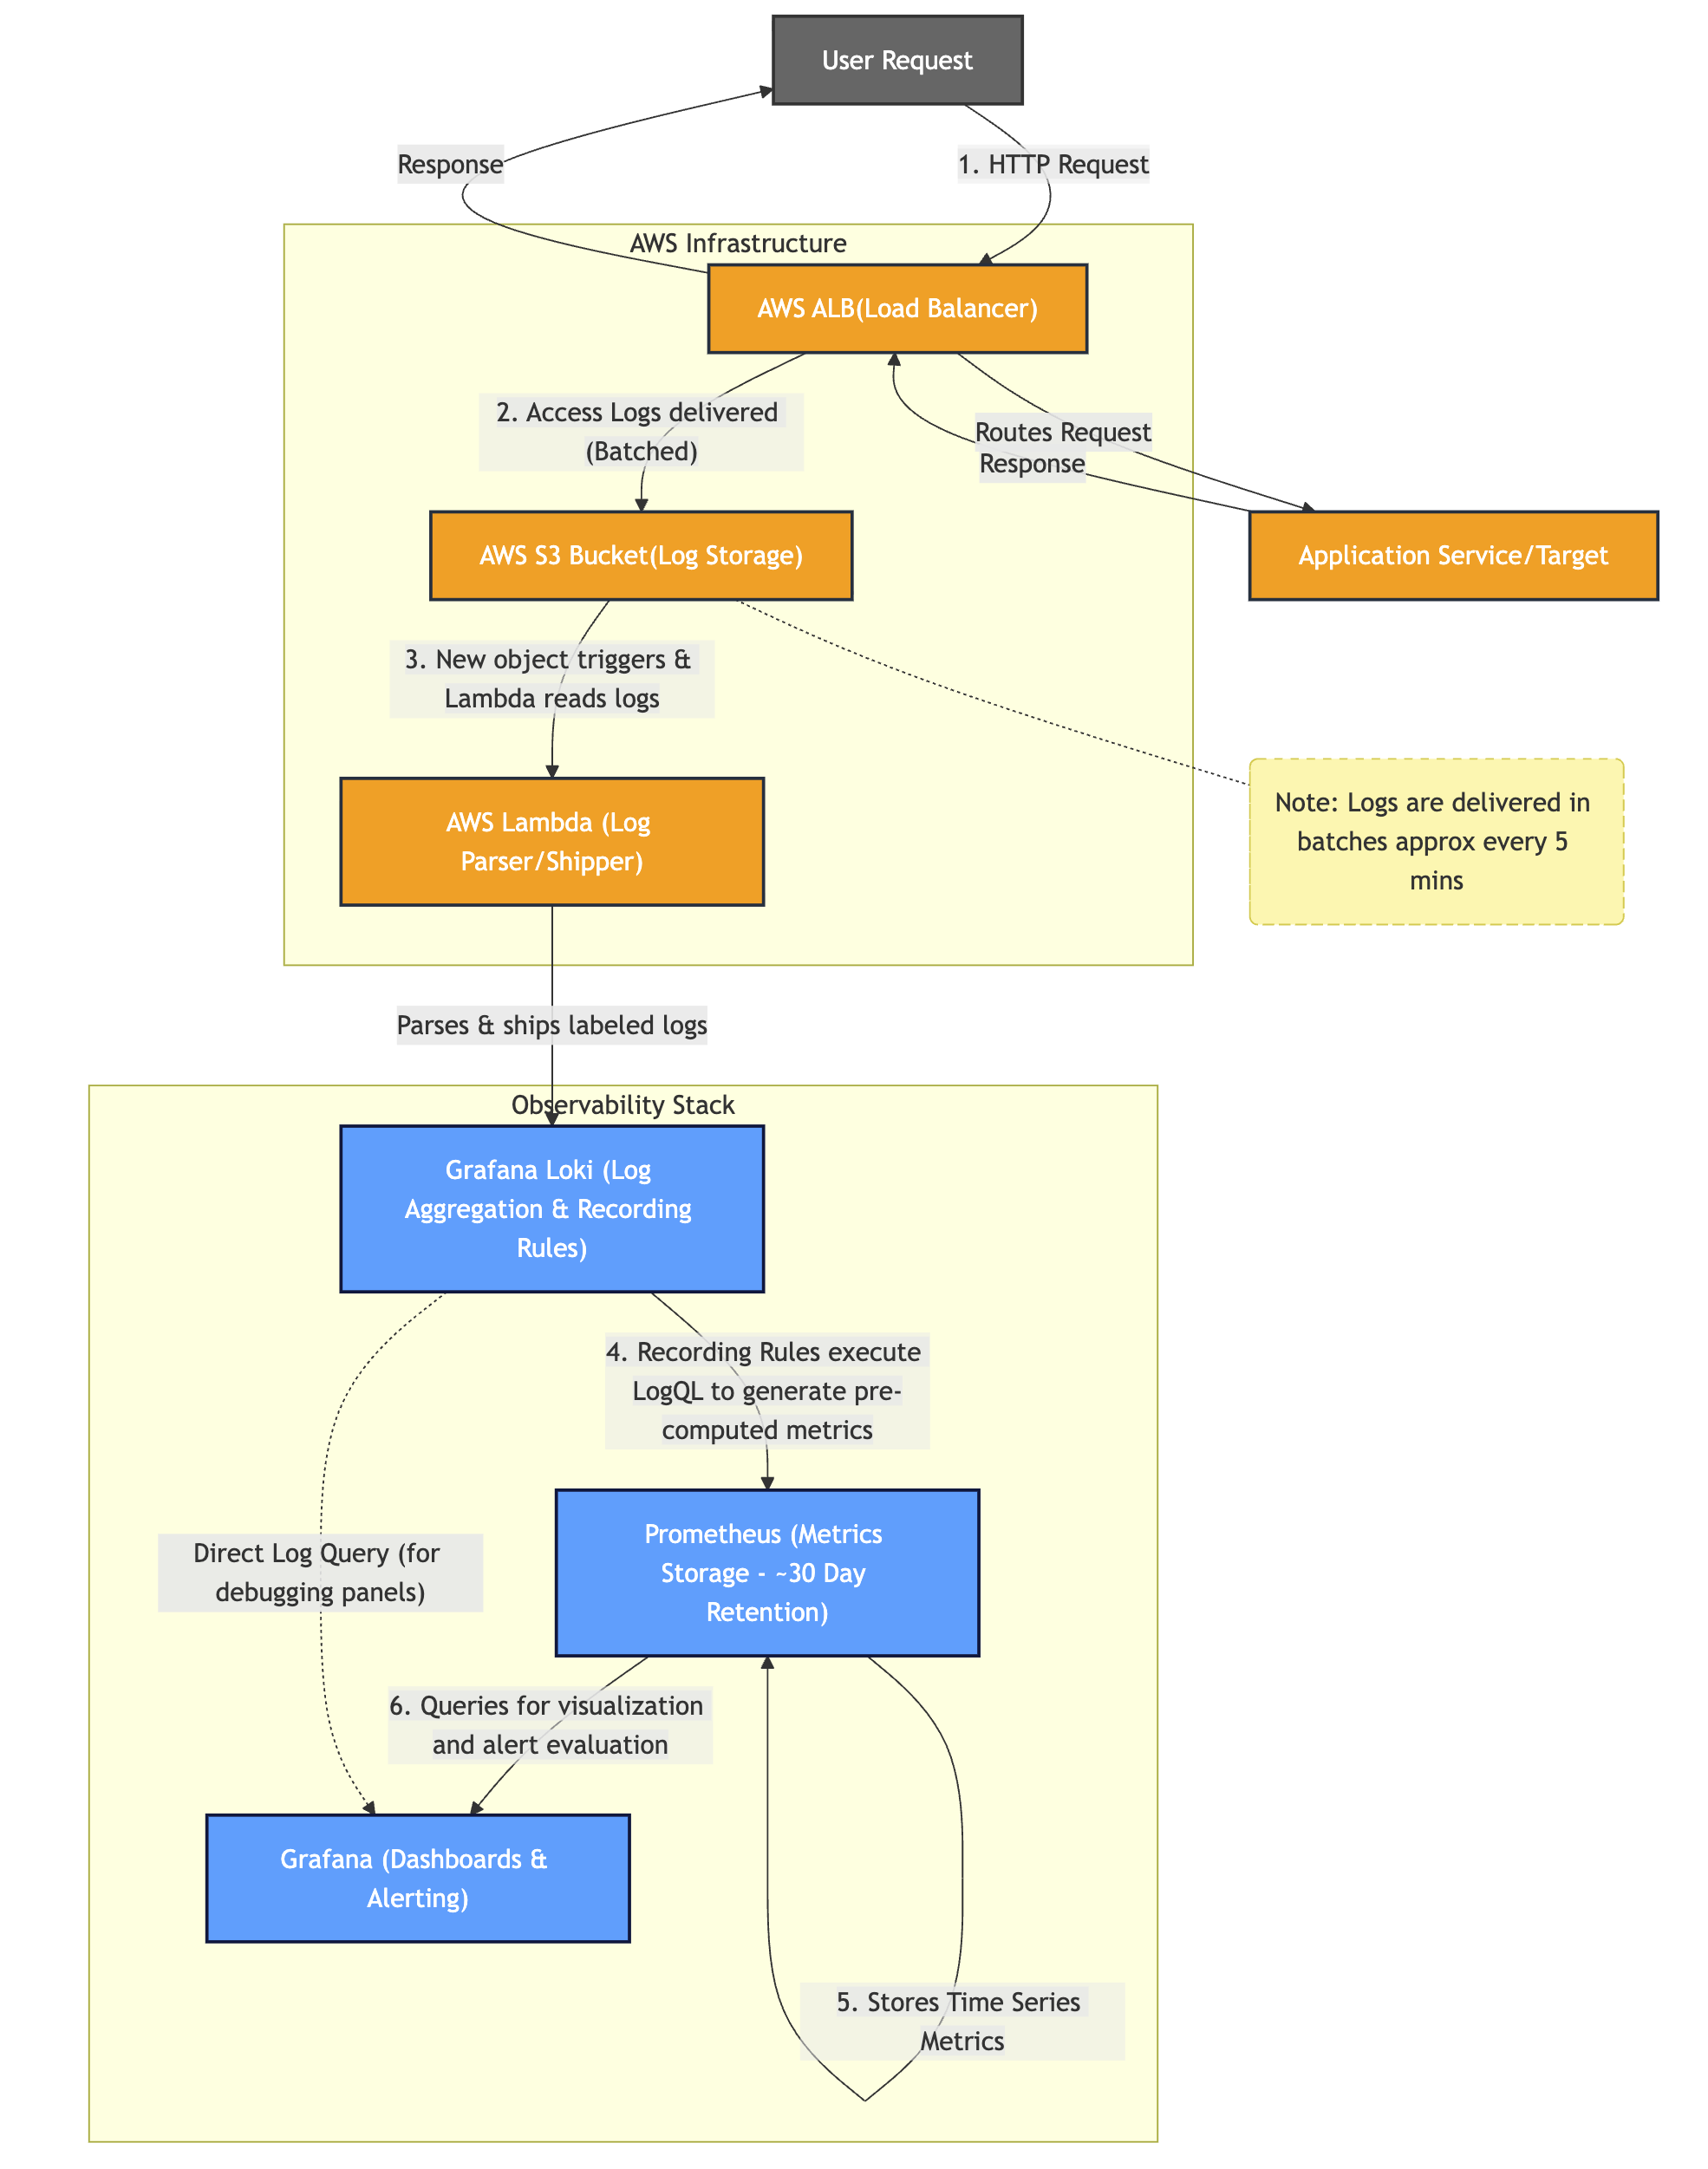
Step 1: The request happens. A user makes a request to one of our services. The ALB routes it to the appropriate target group, waits for the response, and logs the entire transaction.
Step 2: Logs land in S3. AWS delivers ALB access logs to an S3 bucket. Here's the catch — AWS doesn't stream these logs in real-time. Instead, it batches them and delivers a new log file roughly every 5 minutes. This batching behavior becomes important later when we talk about data gaps.
Step 3: Lambda picks them up. A Lambda function triggers on new S3 objects, parses the log entries, and ships them to Loki with appropriate labels (environment, job name, etc.).
Step 4: Loki recording rules run. This is where the magic happens. Loki has recording rules configured that continuously evaluate LogQL queries against incoming data and write the results as Prometheus metrics. Instead of running expensive log queries every time someone opens a dashboard, we pre-compute metrics like request rates, error percentages, and latency percentiles.
Step 5: Prometheus stores the metrics. The recording rule outputs become standard Prometheus time series with labels for service and environment. These metrics are retained for about 30 days.
Step 6: Grafana queries and alerts. Dashboards pull from Prometheus for fast, responsive charts. Alert rules evaluate against the same metrics to detect anomalies.
The heavy lifting (log parsing, aggregation, percentile calculation) happens once in the recording rules. Everything downstream just queries pre-computed metrics.
The 5-Minute Batching Problem
Remember how AWS batches ALB logs every ~5 minutes? This creates a subtle but important issue that took us a while to figure out.
Initially, our recording rules used 1-minute evaluation windows. Seems reasonable, right? Evaluate metrics every minute, get minute-level granularity. The problem is that most of those 1-minute windows were empty because no logs had arrived yet.
Here's what was happening:
Time     | Logs Arriving | 1-min Window Result
---------|---------------|--------------------
00:00    | None          | 0 (empty)
00:01    | None          | 0 (empty)
00:02    | None          | 0 (empty)
00:03    | None          | 0 (empty)
00:04    | None          | 0 (empty)
00:05    | Batch arrives | Actual data
00:06    | None          | 0 (empty)
... and so on
When you look at this data over a short time range (say, the last hour), Grafana's automatic step calculation keeps things fine-grained enough that you see the data points. But zoom out to 7 days for baseline analysis, and Grafana increases the step interval to avoid fetching millions of data points. Suddenly, you're sampling every few minutes, and you keep hitting those empty windows. The result? Dashboards that look broken with massive gaps.
The fix: We aligned our recording rule windows with the log delivery cadence. Instead of rate(...[1m]), we use rate(...[5m]) for smoothed trend metrics. For latency percentiles, we use quantile_over_time(...[5m]). This ensures every evaluation window captures at least one batch of logs.
We still keep some 1-minute metrics for real-time alerting where immediate detection matters, but the discovery dashboards use the 5-minute variants to avoid the sparse data problem.
The Metrics We Generate
Here's what comes out of our recording rules. These are the building blocks for dashboards and alerts.
Request Rate Metrics
| Metric | What It Measures | Typical Use |
|---|---|---|
alb:requests:rate1m | Requests per second, calculated over 1-minute window | Real-time monitoring, "is the service alive" checks |
alb:requests:rate5m | Requests per second, 5-minute window | Trend analysis, baseline discovery, smoother graphs |
The rate metrics count all requests regardless of status code. A spike here tells you traffic increased; it doesn't tell you if that traffic was successful.
Error Rate Metrics
| Metric | What It Measures | Typical Use |
|---|---|---|
alb:errors_5xx:rate1m | Server errors (500-599) per second | Backend failure detection |
alb:errors_4xx:rate1m | Client errors (400-499) per second | API misuse, bad requests |
alb:error_rate_5xx:percent | 5xx errors as percentage of total requests | Normalized alerting thresholds |
alb:error_rate_4xx:percent | 4xx errors as percentage of total requests | Client behavior monitoring |
The percentage metrics are particularly useful for alerts. "1% of requests are failing" is more meaningful than "0.5 errors per second" because it scales with traffic. During a traffic spike, absolute error counts go up even if nothing is wrong.
Latency Metrics
| Metric | What It Measures | Typical Use |
|---|---|---|
alb:latency:p50 | Median response time (50th percentile) | Typical user experience |
alb:latency:p95 | 95th percentile response time | Performance SLO target |
alb:latency:p99 | 99th percentile (tail latency) | Worst-case experience, outlier detection |
Why percentiles instead of averages? Averages can be misleading. If 99 requests take 100ms and one request takes 10 seconds, the average is 199ms. That looks fine! But one in a hundred users is having a terrible experience. P95 and P99 catch these outliers.
The target_time field from ALB logs measures how long the target (your service) took to respond. It excludes ALB processing time, so it's a reasonably accurate measure of your service's performance.
Network Throughput Metrics
| Metric | What It Measures | Typical Use |
|---|---|---|
alb:bytes_received:rate1m | Inbound bytes per second | Request payload monitoring |
alb:bytes_sent:rate1m | Outbound bytes per second | Response payload monitoring |
alb:avg_request_bytes | Average request size | Payload anomaly detection |
alb:avg_response_bytes | Average response size | Response size changes |
These are less commonly used for alerting but helpful for debugging. A sudden spike in response bytes might indicate your service started returning full error stacks instead of clean error messages. Or someone deployed a change that accidentally includes debug data in responses.
Status Distribution Metrics
| Metric | What It Measures |
|---|---|
alb:status_2xx:rate1m | Successful responses per second |
alb:status_3xx:rate1m | Redirects per second |
These round out the picture. Combined with the error metrics, you can account for 100% of your traffic by status category.
Understanding the Labels
Every metric includes two labels that let you slice and filter the data:
service — Derived from the ALB target group name. When a request routes through the load balancer, the target group ARN gets logged. We extract the service identifier from that ARN using regex. The patterns are partial matches, so:
entitlemmatches entitlement-servicenortonaumatches norton-authmetadatamatches metadata-serviceschedulematches task-scheduler
How to Find Your Service Label
To find the correct service label for your application:
- Navigate to EC2 > Target Groups in the AWS Console.
- Search for your service (e.g.,
analyticorebook). - Locate the Target Group matching the pattern
k8s-<namespace>-<service>-<id>. - Copy the ARN or the Target Group Name.
For example, given the ARN:
arn:aws:elasticloadbalancing:us-east-1:100478842646:targetgroup/k8s-ebook-analytic-4fe95c5902/71cc9cd59a4c6c9e
The service identifier is derived from the name segment: k8s-ebook-analytic-4fe95c5902.
In your dashboard queries, you can match this using a regex like service=~".*analytic.*" to capture the relevant service regardless of the random ID suffix.
environment — Pulled from the Lambda function's configuration. Values are dev, qa, stg, or prod.
In your queries, you'll typically filter like this:
alb:requests:rate1m{service=~".*nortonau.*", environment="prod"}
The regex match (=~) with wildcards handles slight variations in target group naming conventions.
Why Baselines Matter
Let's say you're responsible for the authentication service. What threshold should trigger an alert for high latency?
If you pick 500ms, you'll get paged constantly during login surges when latency naturally rises to 400ms. If you pick 1 second, you might miss the gradual degradation that pushes latency from 200ms to 800ms over a week.
The right threshold depends on what's normal for your specific service. And "normal" isn't a single number — it's a distribution that changes throughout the day and week.
The Statistics Behind Baselines
We use basic statistics to define "normal":
Mean (average): The center of your service's typical behavior. If your P95 latency averages 180ms over two weeks, that's your baseline center.
Standard Deviation (σ): How much variation is normal. If your latency bounces between 150ms and 210ms throughout the day, you have a standard deviation of roughly 30ms. If it stays rock-steady at 180ms, your standard deviation is near zero.
The 2σ and 3σ formula: In a normal distribution:
- ~95% of observations fall within 2 standard deviations of the mean
- ~99.7% fall within 3 standard deviations
This gives us a practical threshold formula:
- Warning threshold:
mean + 2 × stdDev— only 2.5% of normal readings exceed this - Critical threshold:
mean + 3 × stdDev— only 0.15% of normal readings exceed this
For our example service with mean=180ms and stdDev=30ms:
- Warning at 240ms (180 + 2×30)
- Critical at 270ms (180 + 3×30)
These thresholds adapt to the actual behavior of each service rather than applying arbitrary numbers across the board.
Traffic Seasonality
Services don't behave the same way at 3 PM on Tuesday as they do at 3 AM on Sunday. You need to account for:
Daily patterns: Most services see higher traffic during business hours (roughly 9 AM to 6 PM Eastern) and much lower traffic overnight. Setting a traffic drop alert based on peak-hour baselines would fire constantly at night.
Weekly patterns: Weekday traffic typically exceeds weekend traffic for B2B services. Educational services might see the opposite pattern.
Our discovery dashboards help you identify these patterns. Once you understand your service's rhythm, you can build time-aware alerts that only fire during relevant periods.
Alert Design Patterns
Not all anomalies deserve the same response. We categorize alerts by what they detect and how urgently someone needs to act.
Traffic Anomalies
| Scenario | What To Alert On | Why It Matters |
|---|---|---|
| Service Down | Request rate = 0 | Complete outage, critical |
| Traffic Drop | Rate below baseline (peak hours only) | Partial failure or routing issue |
| Traffic Spike | Rate above upper threshold | Capacity planning, potential attack |
Service Down alerts should fire fast (2-3 minutes) because zero traffic almost always means something is broken. Either the service crashed, the load balancer can't reach it, or DNS is misconfigured.
Traffic Drop alerts need more nuance. You don't want them firing overnight when low traffic is expected. We use PromQL time functions to scope these:
(
  sum(alb:requests:rate1m{service=~".*nortonau.*", environment="prod"})
  and
  hour() >= 9 and hour() < 18
  and
  day_of_week() != 0 and day_of_week() != 6
)
This only evaluates during business hours on weekdays. The threshold itself comes from baseline analysis of what traffic looks like during those hours.
Traffic Spikes might indicate legitimate growth, a marketing campaign driving users, or something malicious. A warning-level alert with a link to the dashboard lets someone investigate without assuming the worst.
Latency Degradation
| Scenario | What To Alert On | Suggested Duration |
|---|---|---|
| P95 Warning | P95 exceeds baseline + 2σ | 10 minutes |
| P95 Critical | P95 exceeds a severe threshold | 5 minutes |
| Tail Latency | P99 exceeds threshold | 15 minutes |
Latency alerts need longer evaluation periods than availability alerts. A single slow request can spike P99 briefly without indicating a systemic problem. Requiring 10-15 minutes of sustained degradation filters out transient blips.
The P95 metric is usually the best choice for SLO-focused alerting. It represents the experience of your "typical worst-case" user — better than 95% of requests, but catching the degradation that affects a meaningful minority.
P99 alerts catch tail latency issues that might affect only 1% of users. These are worth monitoring but typically at a lower severity since they don't represent widespread impact.
Error Rate Alerts
| Scenario | Threshold Approach | Suggested Duration |
|---|---|---|
| Error Warning | 5xx rate > 1% | 10 minutes |
| Error Critical | 5xx rate > 5% | 5 minutes |
| High Client Errors | 4xx rate > 10% | 15 minutes |
Percentage-based thresholds work better than absolute counts because they scale with traffic. During a traffic spike, you expect more absolute errors even if the error rate stays constant.
The 1% and 5% thresholds are starting points. Some services have naturally higher baseline error rates (authentication services often see more 4xx errors from invalid credentials). Use your baseline analysis to determine what's actually normal for each service.
4xx errors are usually less urgent than 5xx errors because they typically indicate client problems (bad input, authentication failures, requests for resources that don't exist) rather than server problems. But a sudden spike in 4xx errors might indicate API misuse, a broken client deployment, or a security probe.
Linking Alerts to Dashboards
Every alert should include a link to the relevant dashboard panel. When someone gets paged, they shouldn't have to hunt for the right dashboard — the alert should take them directly to the visualization of what triggered it.
In Grafana, you can associate alerts with specific dashboard panels. The alert annotations automatically include dashboardUid and panelId which render as clickable links in the notification.
The Tooling We Provide
Now the platform team provides tools and templates rather than owning every service's monitoring. You know your service better than we do. We give you the instruments; you tune them to your context.
Service Pattern Discovery Dashboard
This is your starting point for baseline analysis. It queries the recording rule metrics over a configurable time range (we recommend 7-14 days, up to 30 days if Prometheus retention allows) and shows you:
- Traffic patterns: Request rate over time with mean, max, min, and standard deviation in the legend
- Latency percentiles: P50, P95, P99 with statistical summaries
- Error rates: 5xx and 4xx percentages over time
- Suggested thresholds: Auto-calculated values using the mean + 2σ formula
There are actually two versions:
- Fast version Queries Prometheus metrics, responds in seconds and metric based (up to 30 days)
- Slow version Queries Loki directly for deeper historical analysis, takes longer to load but can see further back
Service Dashboard Template
Once you've established baselines, clone this template to create your team's operational dashboard. It includes:
- Traffic rate panel with configurable thresholds
- Latency percentile panels
- Error rate tracking
- Network throughput graphs
- Recent error logs (direct Loki query for debugging)
The template uses placeholder configurations that you customize for your service. After setup, delete the instruction panel and save it to your team's folder. You can find the template here.
Infrastructure Templates
For teams with AWS infrastructure dependencies, we also provide:
- RDS Database Template CPU, memory, connections, storage, and query latency from CloudWatch metrics
These use the CloudWatch data source rather than ALB metrics since database monitoring is a different data path entirely. (More infrastructure templates will be added in the future.)
Technical Implementation Details
For those who want to understand (or modify) the underlying implementation, here are the details:
Loki Recording Rule Structure
Recording rules are defined in a Kubernetes ConfigMap that Loki loads on startup. The structure looks like:
groups:
  - name: alb_request_rates
    interval: 1m
    rules:
      - record: alb:requests:rate1m
        expr: |
          sum by (service, environment) (
            rate({job="alb_logs_lambda"}
              | pattern `<type> <timestamp> <elb> ...`
              | label_format environment="{{.environment}}"
              | line_format "{{.target_group_arn}}"
              | regexp "targetgroup/(?P<service>[^/]+)/"
              [1m]
            )
          )
Key points:
interval: 1mmeans the rule evaluates every minute- The
patternparser extracts fields from the structured ALB log format regexpextracts the service name from the target group ARNsum by (service, environment)aggregates across all matching log lines while preserving those labels
Prometheus Retention
Our Prometheus instance retains data for approximately 30 days. This means:
- Real-time dashboards work great
- Week-over-week comparisons are possible
- Month-over-month analysis requires Loki queries (slower but longer retention) for data older than 30 days
When doing baseline analysis, keep this retention limit in mind. The Service Pattern Discovery dashboard won't show Prometheus data older than the retention period.
Grafana Aggregation Techniques
For dashboards that need to show statistics over the entire selected time range (not just per-point), we use $__range variable with aggregation functions:
avg_over_time(alb:latency:p95{service=~".*$service.*"}[$__range])
This calculates the average of all P95 values across whatever time range the user has selected. Combined with Grafana's "Stat" visualization, this powers the summary statistics panels in the discovery dashboard.
For standard deviation:
stddev_over_time(alb:latency:p95{service=~".*$service.*"}[$__range])
These functions handle sparse data correctly, unlike Grafana's client-side reduce transformations which can produce misleading results when data points are missing.
Reference Implementation: NortonAuth
As a demonstration, we implemented the full alert suite for the norton-auth service. Here's what we configured and why:
| Alert | Threshold | Derivation |
|---|---|---|
| Service Down | rate = 0 for 3m | Universal — zero traffic is always bad |
| Traffic Drop (Peak Traffic) | < 13.9 req/s during analyzed peak traffic hours | Baseline mean minus 2σ for weekday afternoons |
| Traffic Spike | > 102 req/s for 3m | Baseline mean plus 3σ |
| P95 Warning | > 500ms for 10m | Baseline P95 mean plus 2σ |
| P95 Critical | > 1.5s for 5m | Approximately baseline plus 4σ |
| P99 Elevated | > 2s for 15m | Conservative threshold for tail latency |
| Error Warning | > 1% 5xx for 10m | Standard starting point |
| Error Critical | > 5% 5xx for 5m | Significant degradation |
| High Client Errors | > 10% 4xx for 15m | Unusual client behavior |
| Throughput Anomaly | > 100KB/s sent for 15m | Info-level for capacity awareness |
These thresholds came directly from analyzing NortonAuth's baseline data over a 14-day period. Your service's thresholds will differ based on its traffic patterns, latency profile, and error characteristics.
Summary
This system exists because one-size-fits-all alerting doesn't work. What's normal for an authentication service isn't normal for a metadata lookup service. What's acceptable at 2 AM isn't acceptable at 2 PM.
By converting ALB logs into Prometheus metrics and building discovery tools on top, we've created a way for teams to understand their service's actual behavior and set thresholds accordingly. The result should be fewer false positives (alerts that fire when nothing is actually wrong) and faster detection of true anomalies (alerts that catch real problems before users notice).
Remember: the ALB-based approach is a pragmatic solution to our current lack of native service metrics. It works, but it's not ideal. If you're in a position to add proper instrumentation to your service, please do. The platform team is happy to help.
What's Next
- How-To Guide: "How-To: Using Service Pattern Discovery and Dashboard Templates" — step-by-step instructions for setting up monitoring for your service
References
- Grafana Alerting Documentation: https://grafana.com/docs/grafana/latest/alerting/
- Prometheus Recording Rules: https://prometheus.io/docs/prometheus/latest/configuration/recording_rules/
- AWS ALB Access Logs: https://docs.aws.amazon.com/elasticloadbalancing/latest/application/load-balancer-access-logs.html
- Loki Recording Rules: https://grafana.com/docs/loki/latest/alert/