How-To: Using Service Pattern Discovery and Dashboard Templates
Introduction
This guide walks you through setting up baseline monitoring for your service using the platform team's discovery dashboards and templates. By the end, you'll have a customized dashboard showing your service's health and a set of alerts tuned to your service's actual behavior patterns.
The whole process takes about an hour if you're methodical about it. Most of that time is waiting for the discovery dashboard to show you enough data to make informed decisions about thresholds.
Before You Start: This guide assumes you've read the explanation document "Understanding ALB Service Metrics and Baseline Monitoring". That document covers the why behind everything here — how the metrics pipeline works, what baselines mean statistically, and the rationale for different alert patterns. This guide focuses on the how.
Prerequisites
Before diving in, make sure you have:
- Grafana access with permissions to create dashboards and alerts in your team's folder
- A service running behind ALB that's been deployed for at least a few days (ideally 1-2 weeks for good baseline data)
- Your service's target group pattern — we'll show you how to find this in the first section
- 30-60 minutes of uninterrupted time to do this properly
Finding Your Service Label
Every metric in this system uses a service label derived from the ALB target group name. Before you can query anything, you need to know what pattern to match.
Step 1: Find Your Target Group in AWS
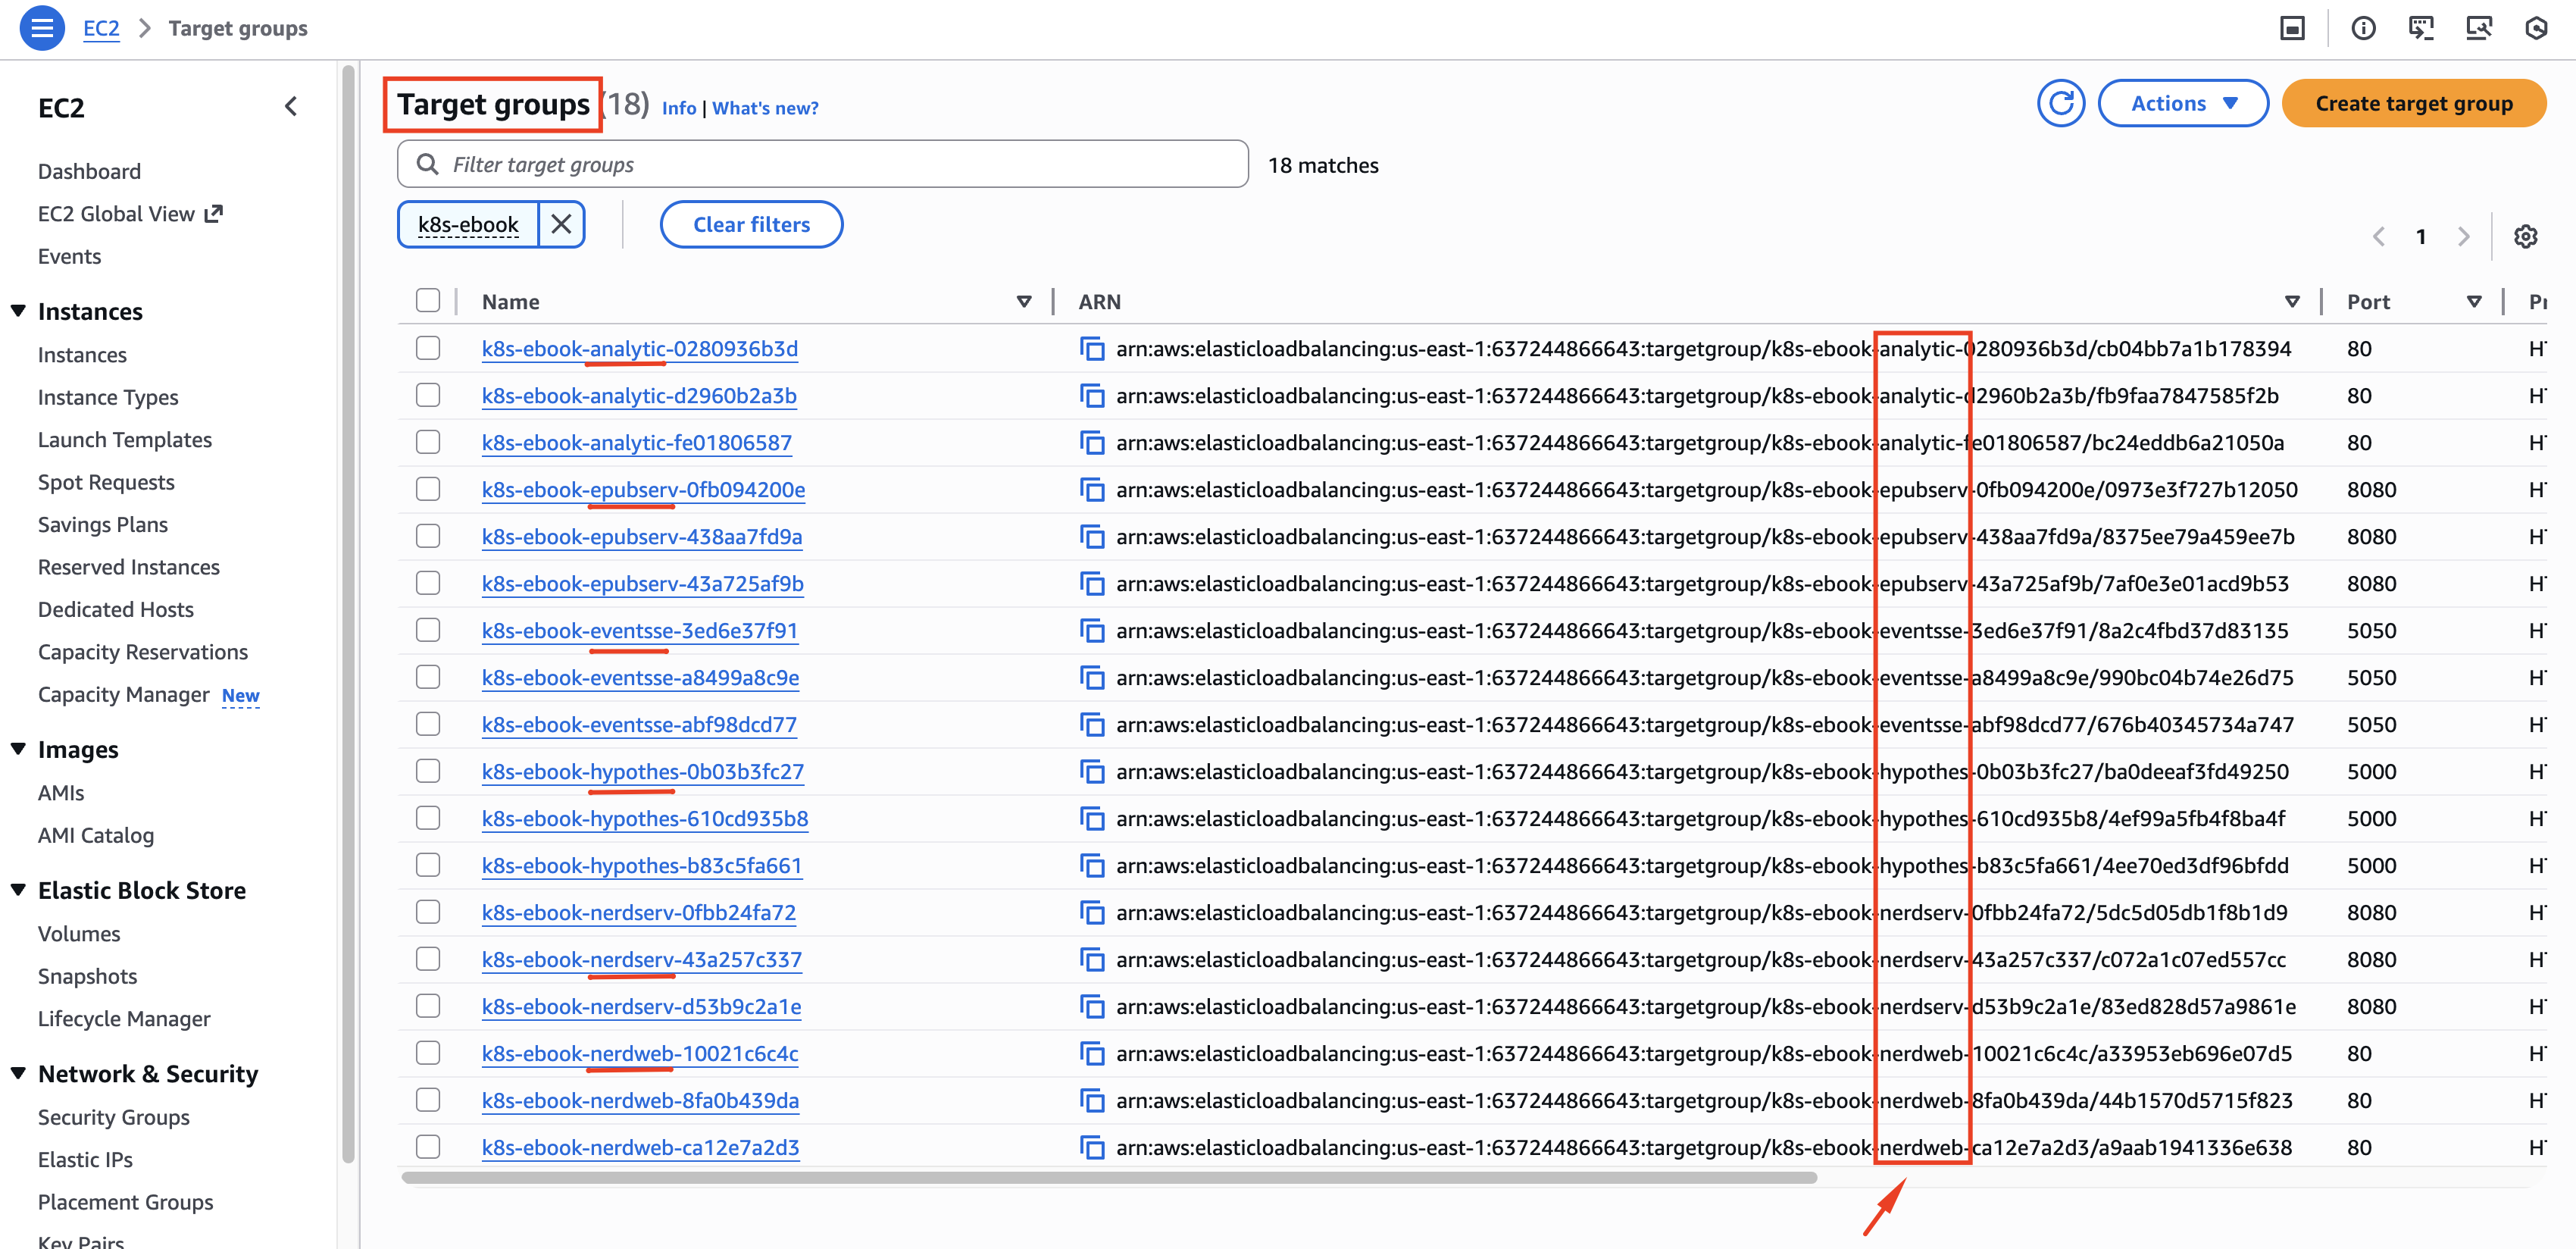
- Open the AWS Console and navigate to EC2 → Target Groups
- Search for your service name (try partial matches like
analyticorebook) - Look for target groups following the pattern
k8s-<namespace>-<service>-<random_id>
Step 2: Extract the Service Pattern
From the target group name, identify the portion you'll use for regex matching.
For example, if your target group is:
k8s-ebook-analytic-4fe95c5902
Your service pattern for queries would be analytic (the unique identifying portion).
Don't include the random suffix in your pattern. Target groups can be recreated with different IDs during infrastructure changes. Use just the stable part of the name that identifies your service.
Step 3: Verify the Pattern Works
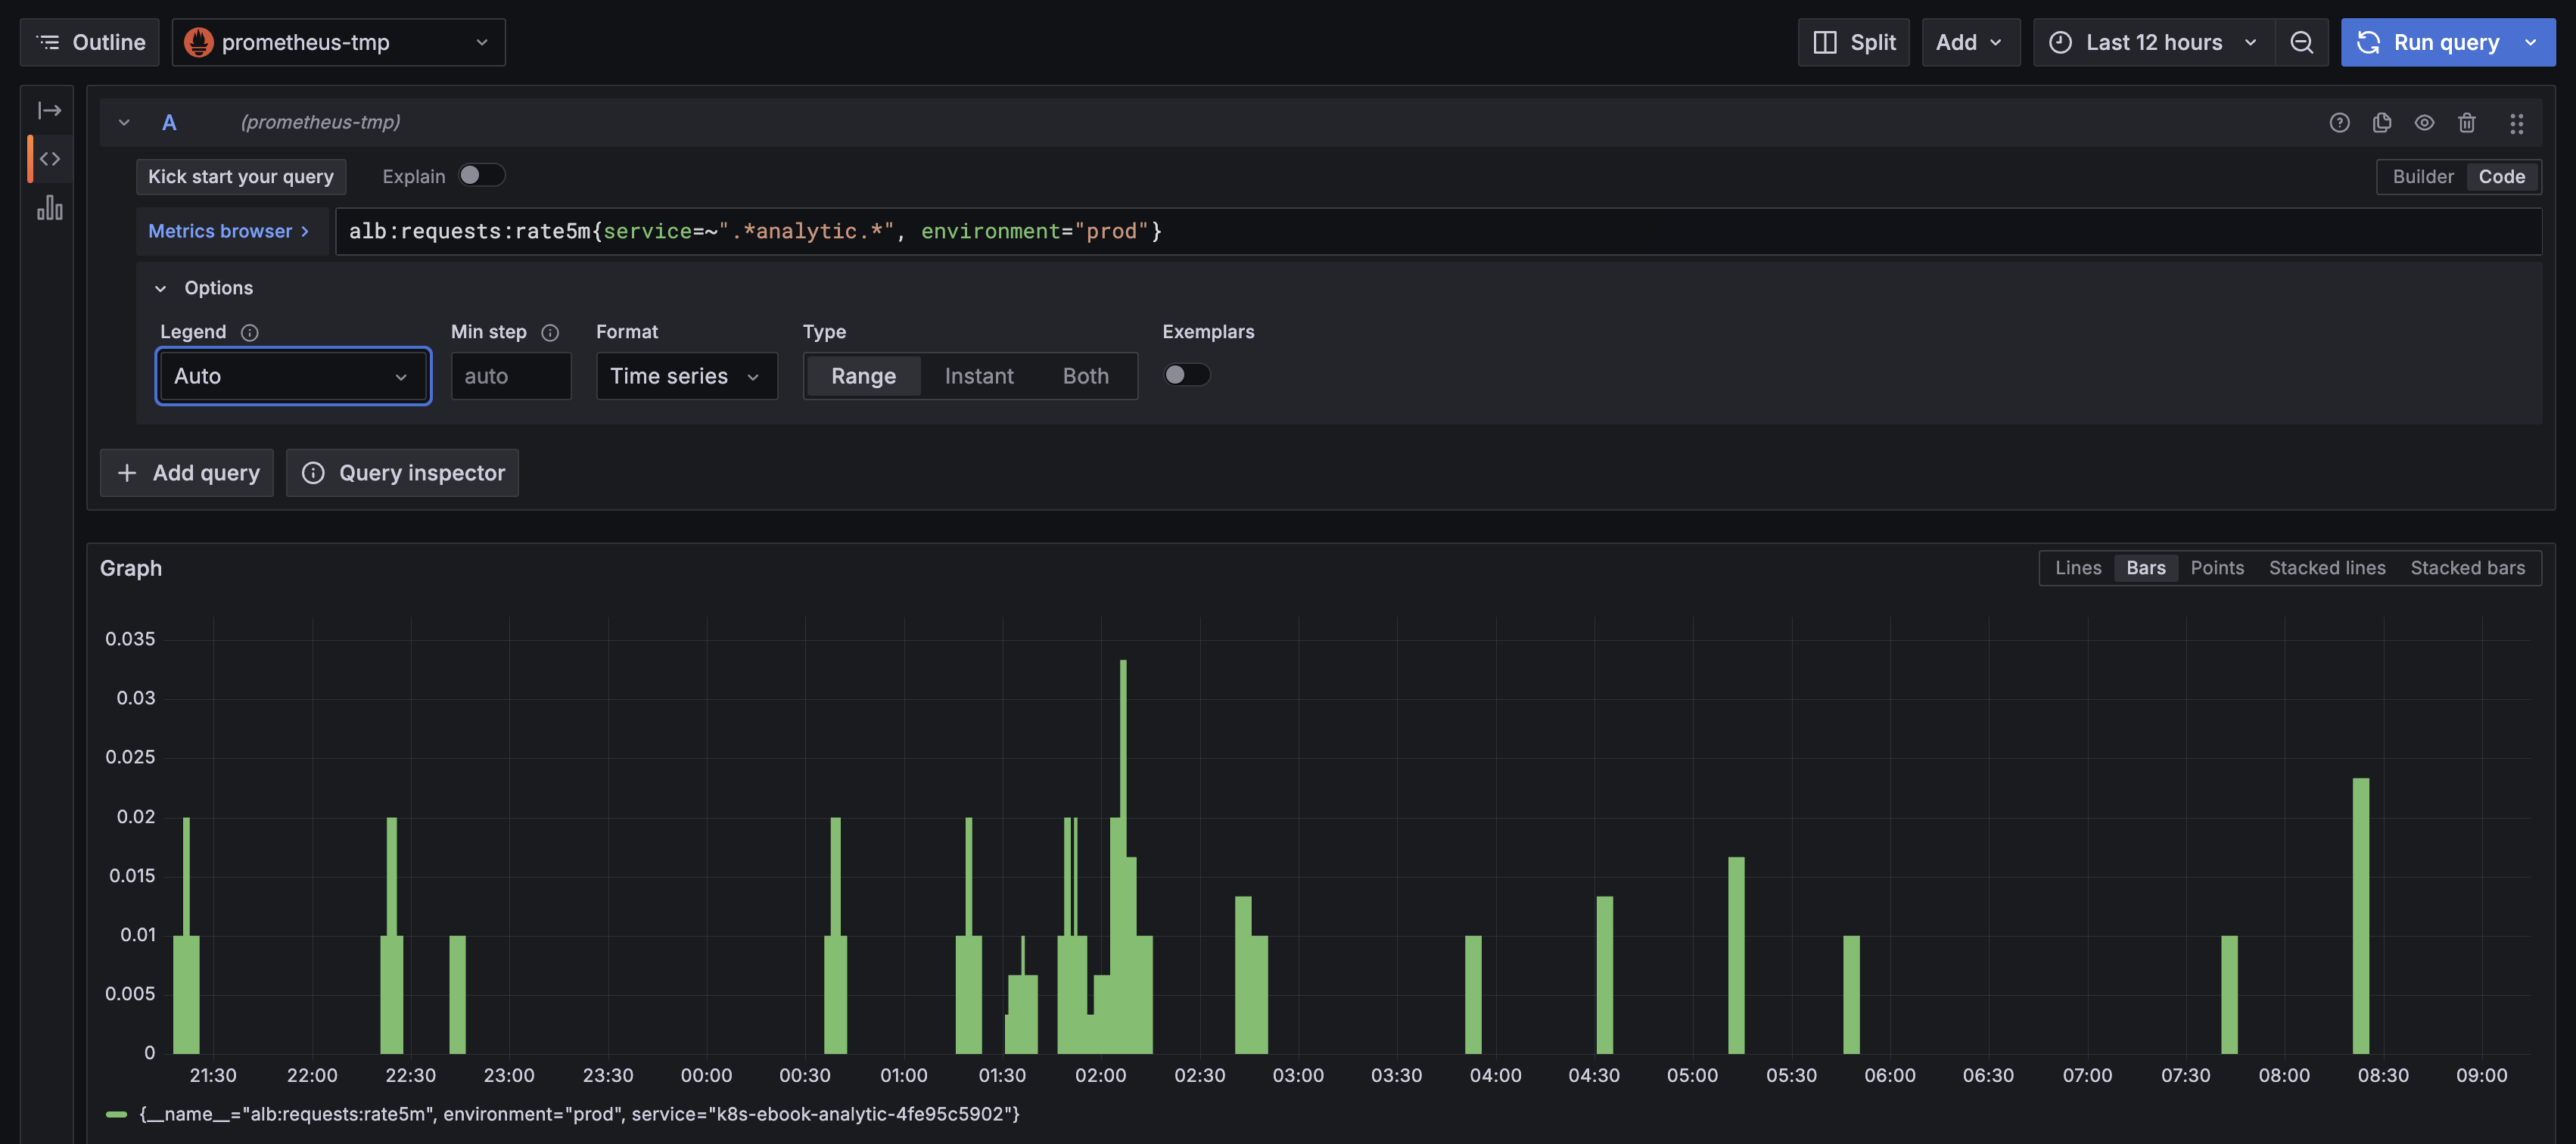
Open Grafana and run a quick test query in the Explore view:
- Go to Explore (compass icon in the left sidebar)
- Select the Prometheus datasource
- Enter this query, replacing
YOUR_SERVICEwith your pattern:
alb:requests:rate5m{service=~".*YOUR_SERVICE.*", environment="prod"}
If you see data, you've got the right pattern. If not, try variations or check that your service has been receiving traffic.
Phase 1: Discovering Your Service's Baselines
This is the most important phase. You're going to analyze your service's historical behavior to understand what "normal" looks like. Rush this, and you'll end up with thresholds that either never fire or fire constantly.
Step 1: Open the Service Pattern Discovery Dashboard
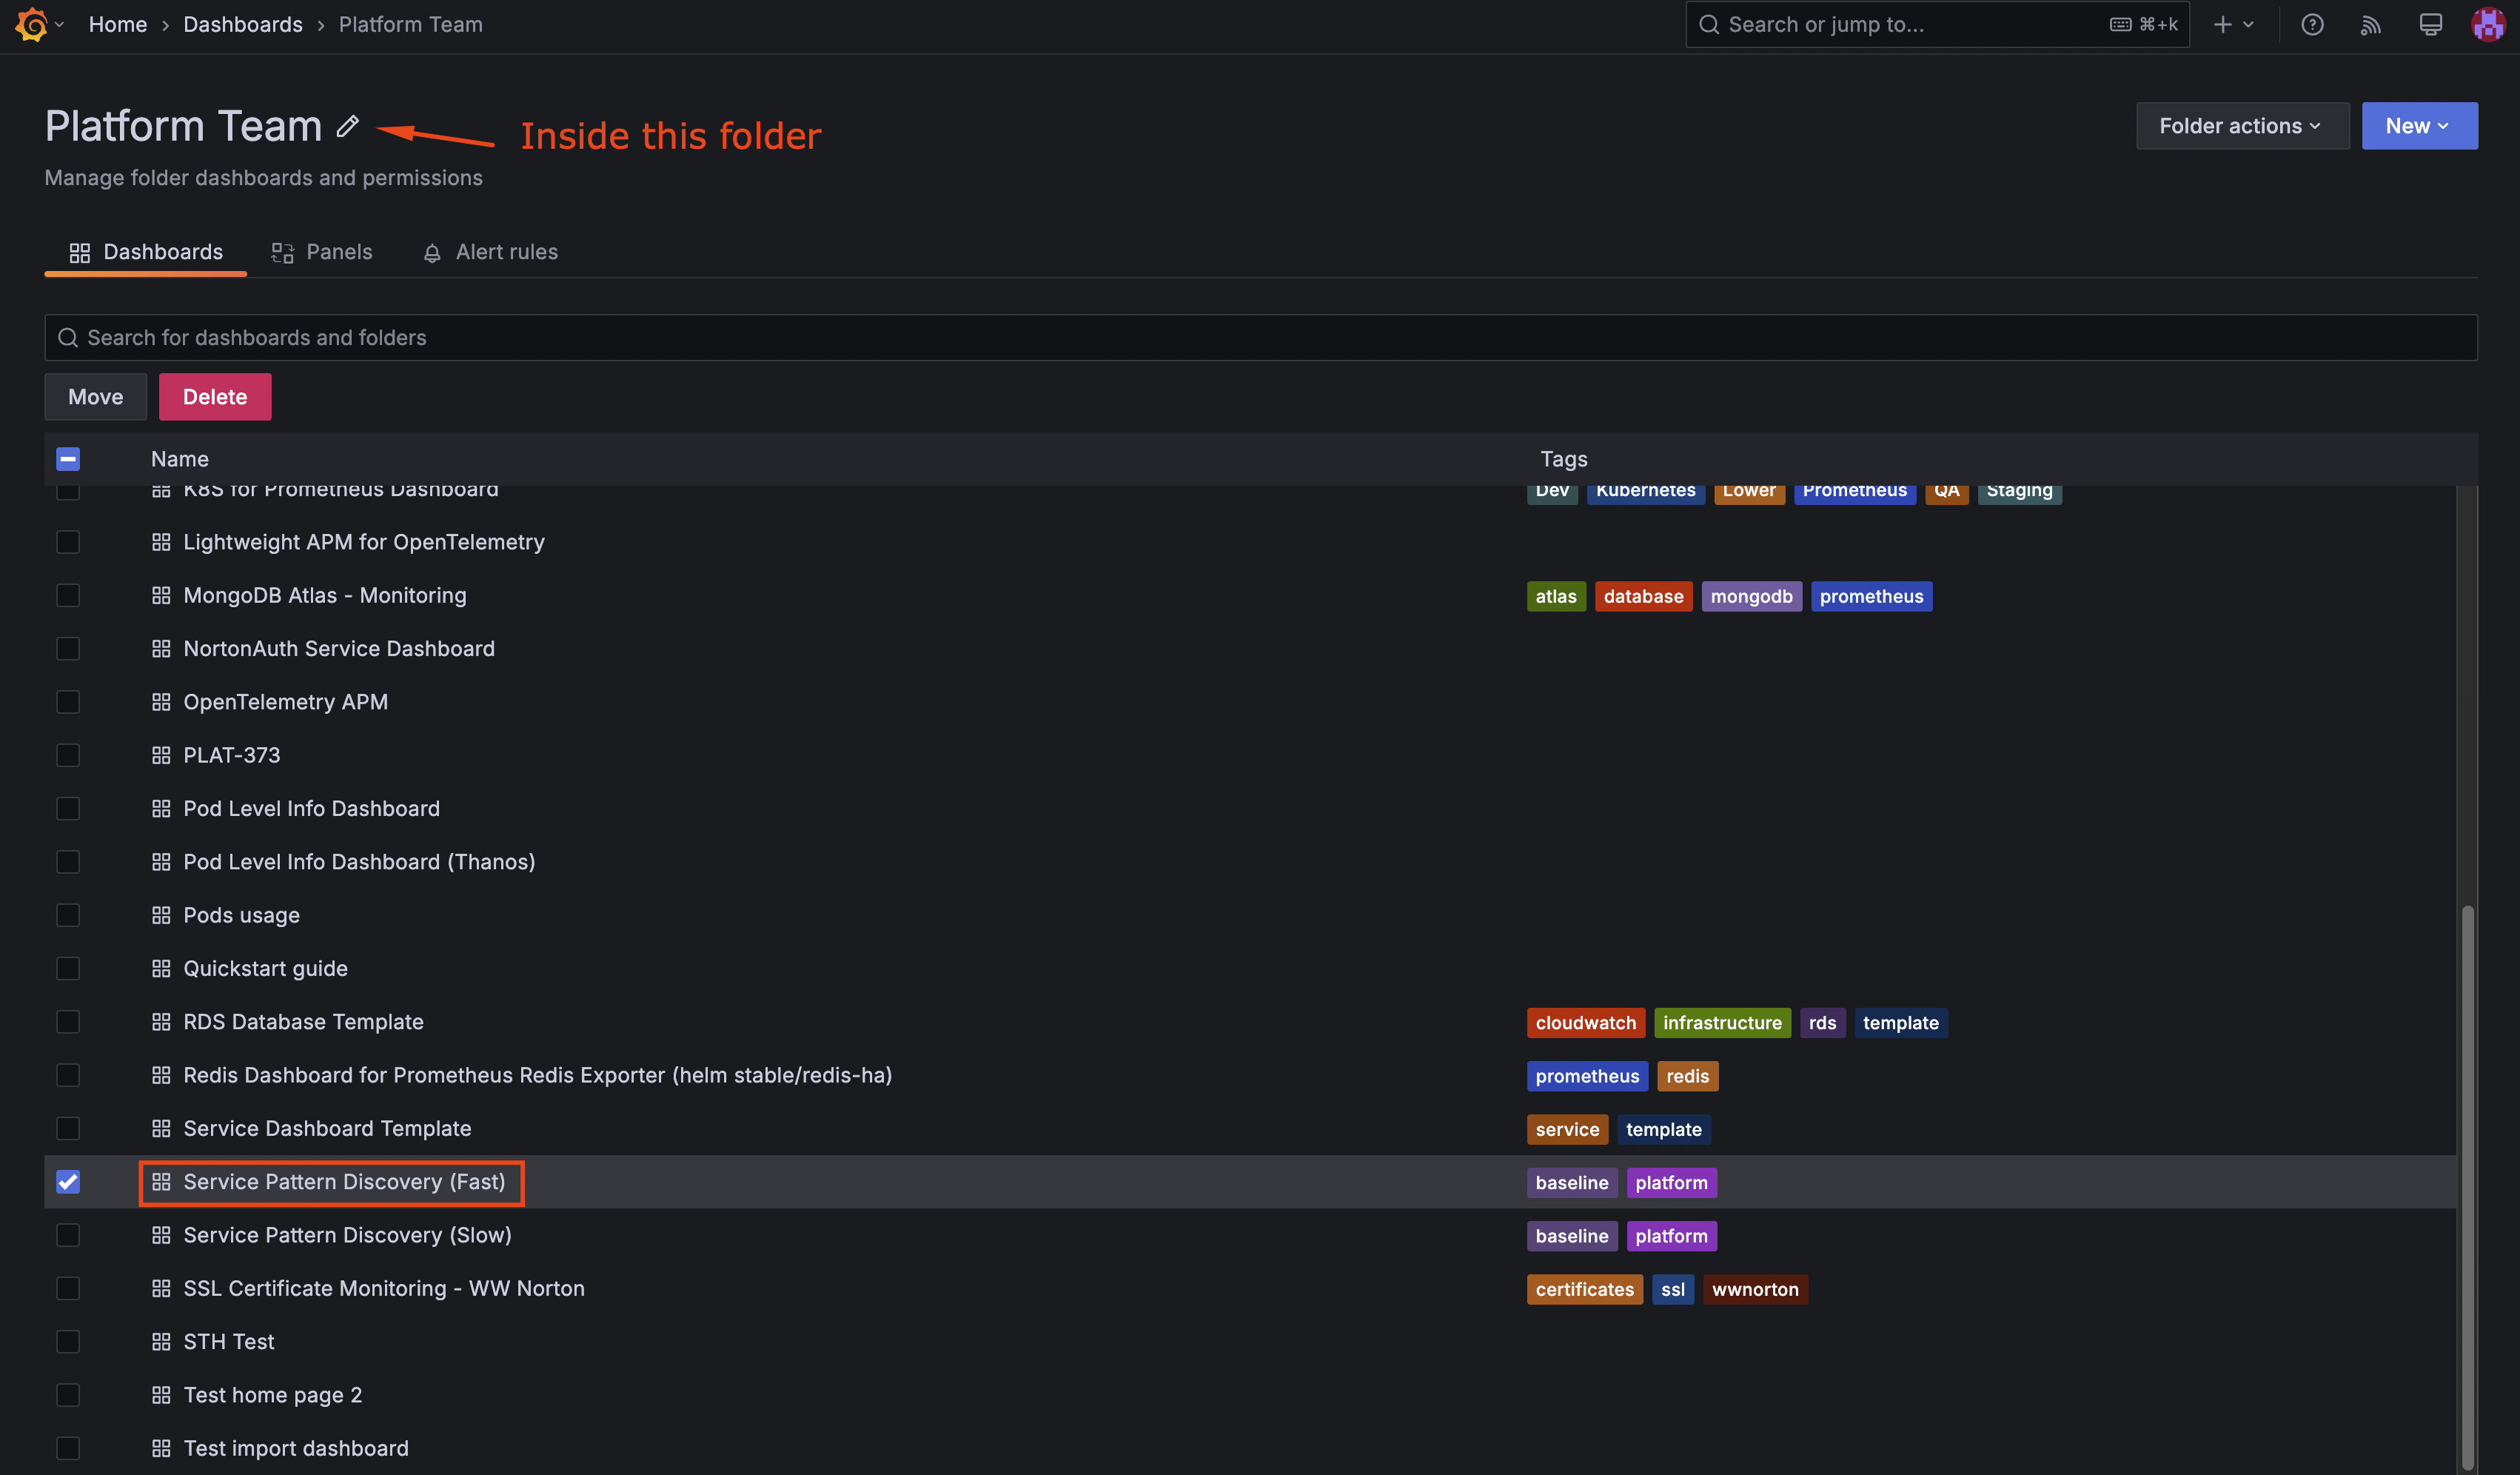
Navigate to: Dashboards → Platform Team → Service Pattern Discovery (Fast)
Or use this direct link: Service Pattern Discovery (Fast)
Step 2: Configure the Dashboard Variables
At the top of the dashboard, you'll see dropdown selectors for filtering the data:
- service: Enter your service pattern (e.g.,
analytic,nortonau,metadata) - environment: Select
prod— you want baselines from production behavior - prometheus_datasource: Should default correctly, but verify it's pointing to the right Prometheus instance

Step 3: Set the Analysis Time Range
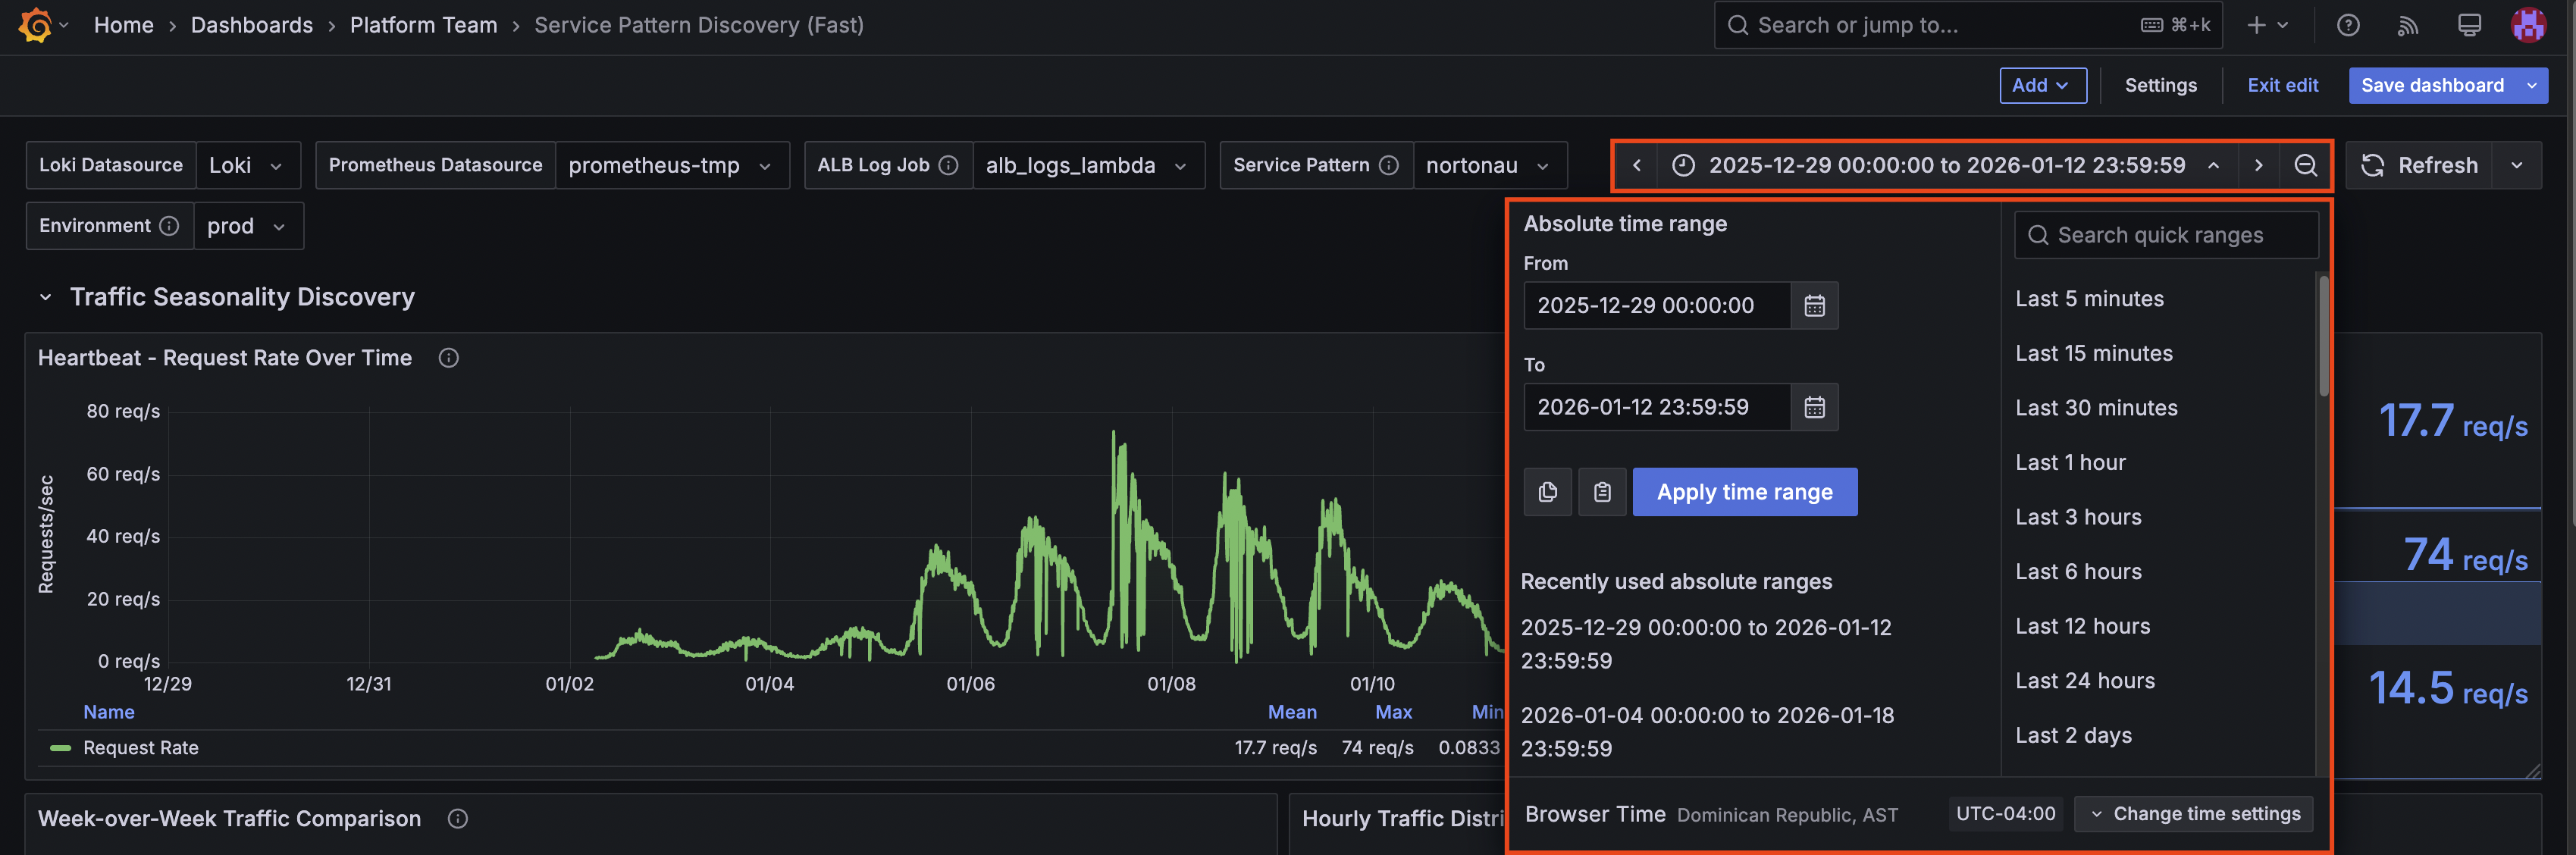
Click the time picker in the top-right corner and select a range that gives you meaningful data:
- Minimum: 7 days (enough to see weekly patterns)
- Recommended: 14 days (captures two full weekly cycles) for this one you will have to input the date range manually
- Maximum useful: 30 days (beyond this, Prometheus retention may limit data)
Why 14 days? Services often behave differently on different days of the week. A single week might not show you that Friday traffic is always lower, or that Monday mornings have a spike. Two weeks smooths out anomalies and shows you the real patterns.
Step 4: Analyze Traffic Patterns
Start with the "Heartbeat - Request Rate Over Time" panel. This shows your service's traffic volume over the selected period.
What to look for:
Look at the legend table below the graph. It shows calculated statistics:
| Stat | What It Tells You |
|---|---|
| Mean | Your average traffic level — the center of "normal" |
| Max | Peak traffic observed — useful for capacity planning |
| Min | Lowest traffic — check if zeros are expected (overnight?) |
| Std Dev | How much traffic varies — low means consistent, high means bursty |
Record these values. You'll use them to calculate thresholds.
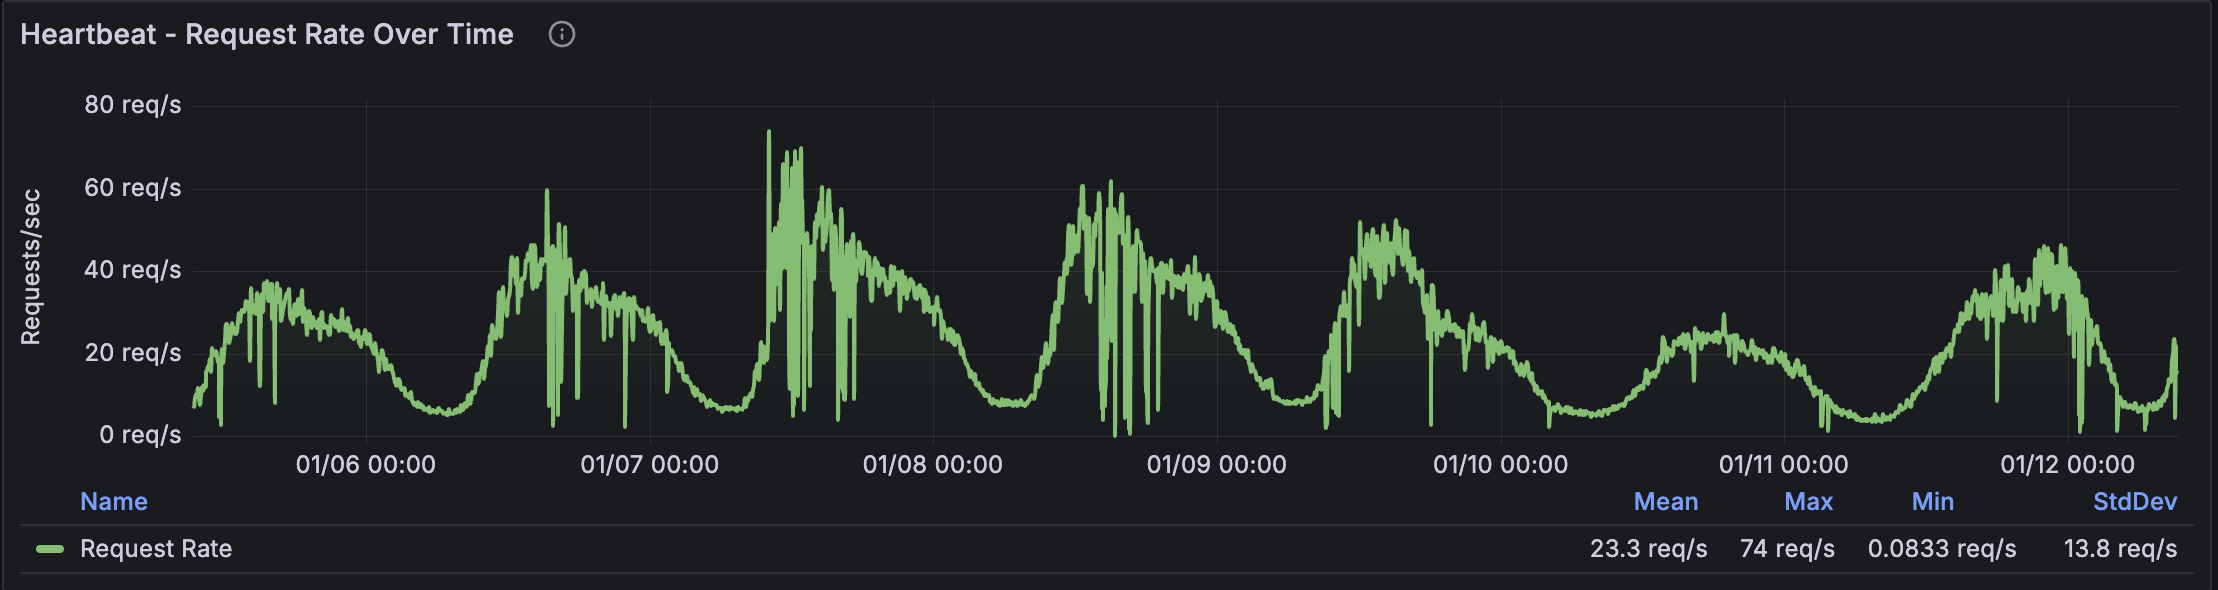
Identify patterns:
- Do you see daily cycles? (Higher during business hours, lower at night)
- Do you see weekly cycles? (Different on weekends vs weekdays)
- Are there regular spikes? (Batch jobs, scheduled tasks)
These patterns affect how you'll configure alerts. A traffic drop alert that fires at 2 AM when traffic is supposed to be low is just noise.
Step 5: Analyze Latency Patterns
Scroll to the "Latency Percentiles" section. This shows P50, P95, and P99 response times.
Focus on P95 — this is typically the metric you'll alert on. It represents the experience of the slowest 5% of requests while filtering out extreme outliers.
From the legend, record:
- P95 Mean: Your baseline latency
- P95 Max: Worst observed latency (was there an incident during this period?)
- P95 Std Dev: How much latency varies
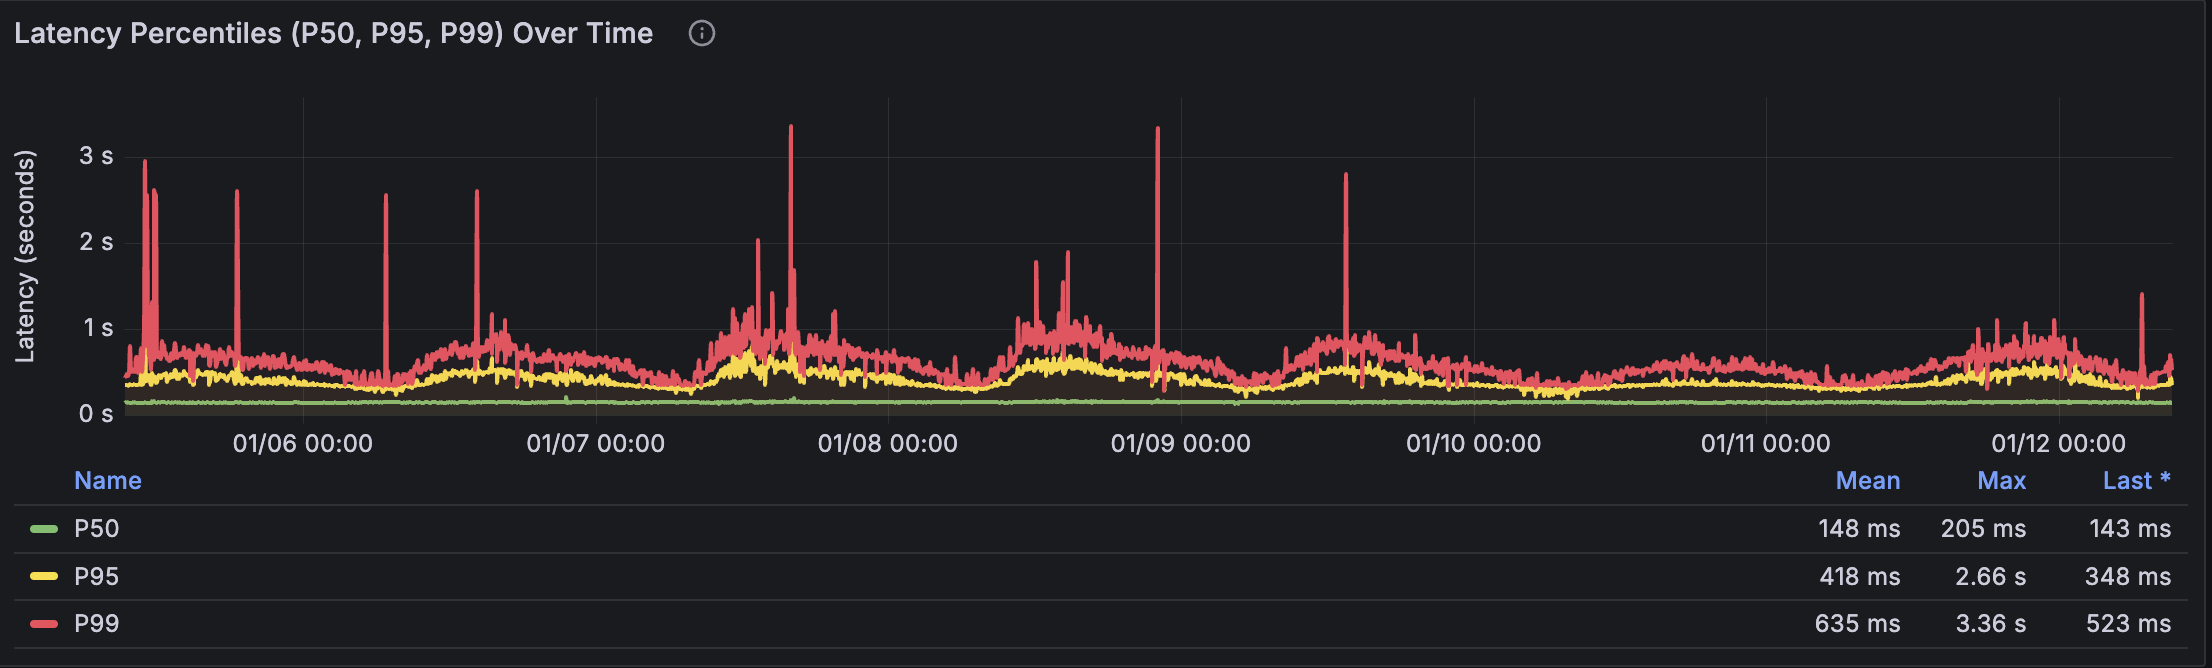
Check for anomalies in your analysis window. If there was an outage or incident during the 14 days you're analyzing, those data points will skew your statistics. Consider adjusting your time range to exclude known incidents, or mentally account for them when setting thresholds.
Step 6: Analyze Error Patterns
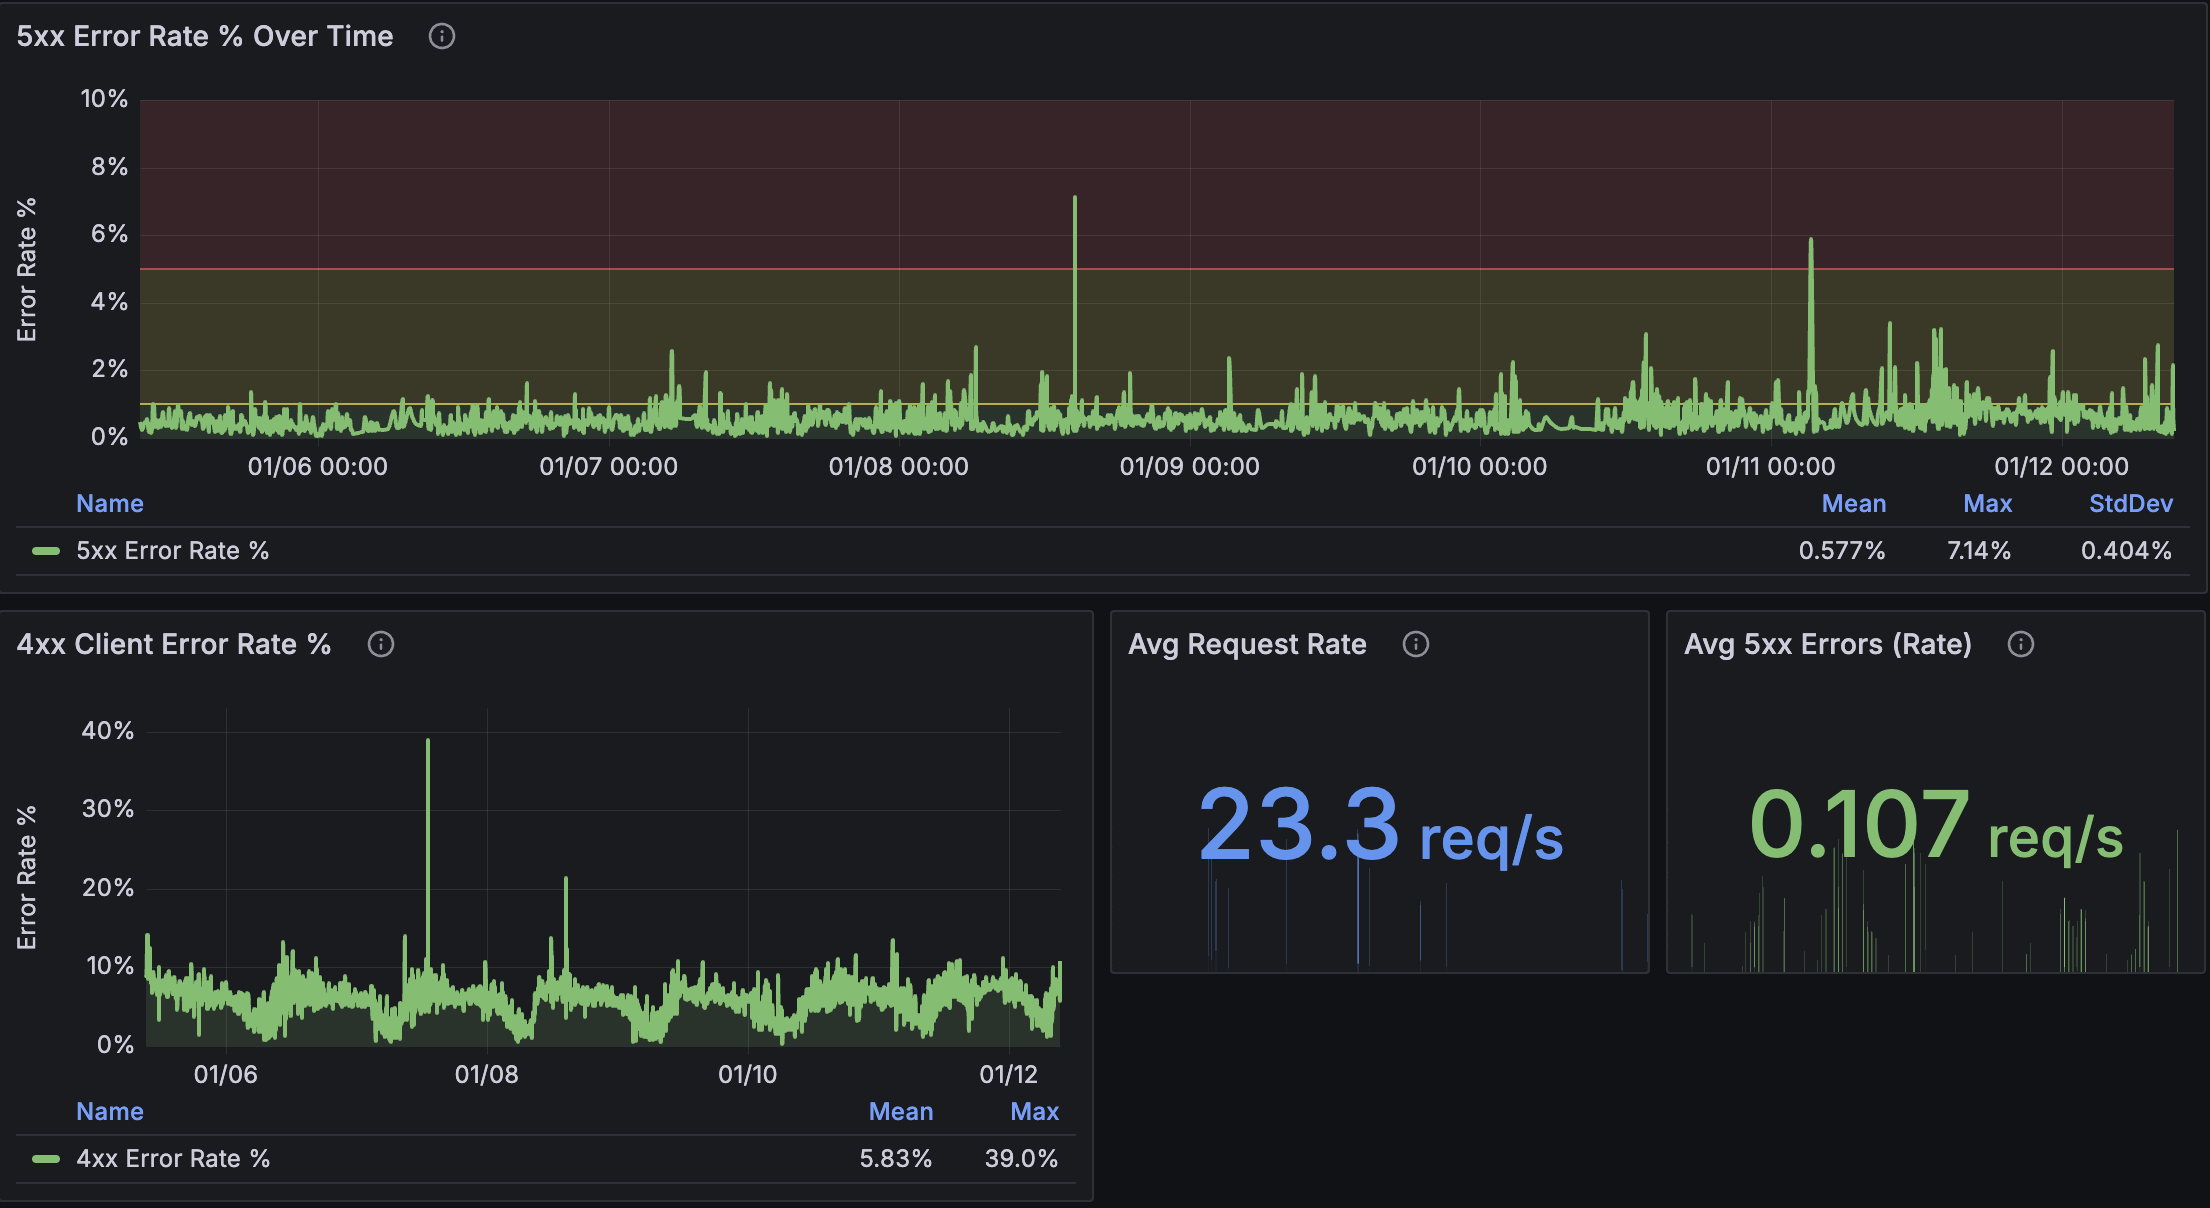
Look at the "Error Rate Analysis" section showing 5xx and 4xx error percentages.
For 5xx errors:
- What's the typical rate? Many services run at 0% most of the time
- Are there patterns? Errors during deployments? Scheduled maintenance windows?
For 4xx errors:
- These are often higher than 5xx (client errors like 404s, 401s)
- Authentication services naturally see more 4xx (failed login attempts)
Record the mean and maximum for both.
Step 7: Document Your Baselines
Before moving on, write down what you've learned. You'll need this when configuring alerts.
## [Your Service Name] Baseline Analysis

**Analysis Period:** [start date] to [end date]
**Environment:** Production

### Traffic

- Mean: **\_** req/s
- Max: **\_** req/s
- Std Dev: **\_** req/s
- Pattern Notes: [daily cycles? weekend differences?]

### Latency (P95)

- Mean: **\_** ms
- Max: **\_** ms
- Std Dev: **\_** ms

### Error Rates

- 5xx Mean: **\_** %
- 5xx Max: **\_** %
- 4xx Mean: **\_** %

### Calculated Thresholds

- Traffic Drop Warning: **\_** req/s (mean - 2σ)
- Traffic Spike Warning: **\_** req/s (mean + 2σ)
- P95 Latency Warning: **\_** ms (mean + 2σ)
- P95 Latency Critical: **\_** ms (mean + 3σ)
- 5xx Error Warning: **\_** %
Phase 2: Creating Your Service Dashboard
Now that you understand your service's baseline behavior, let's create a dashboard you can use for day-to-day monitoring.
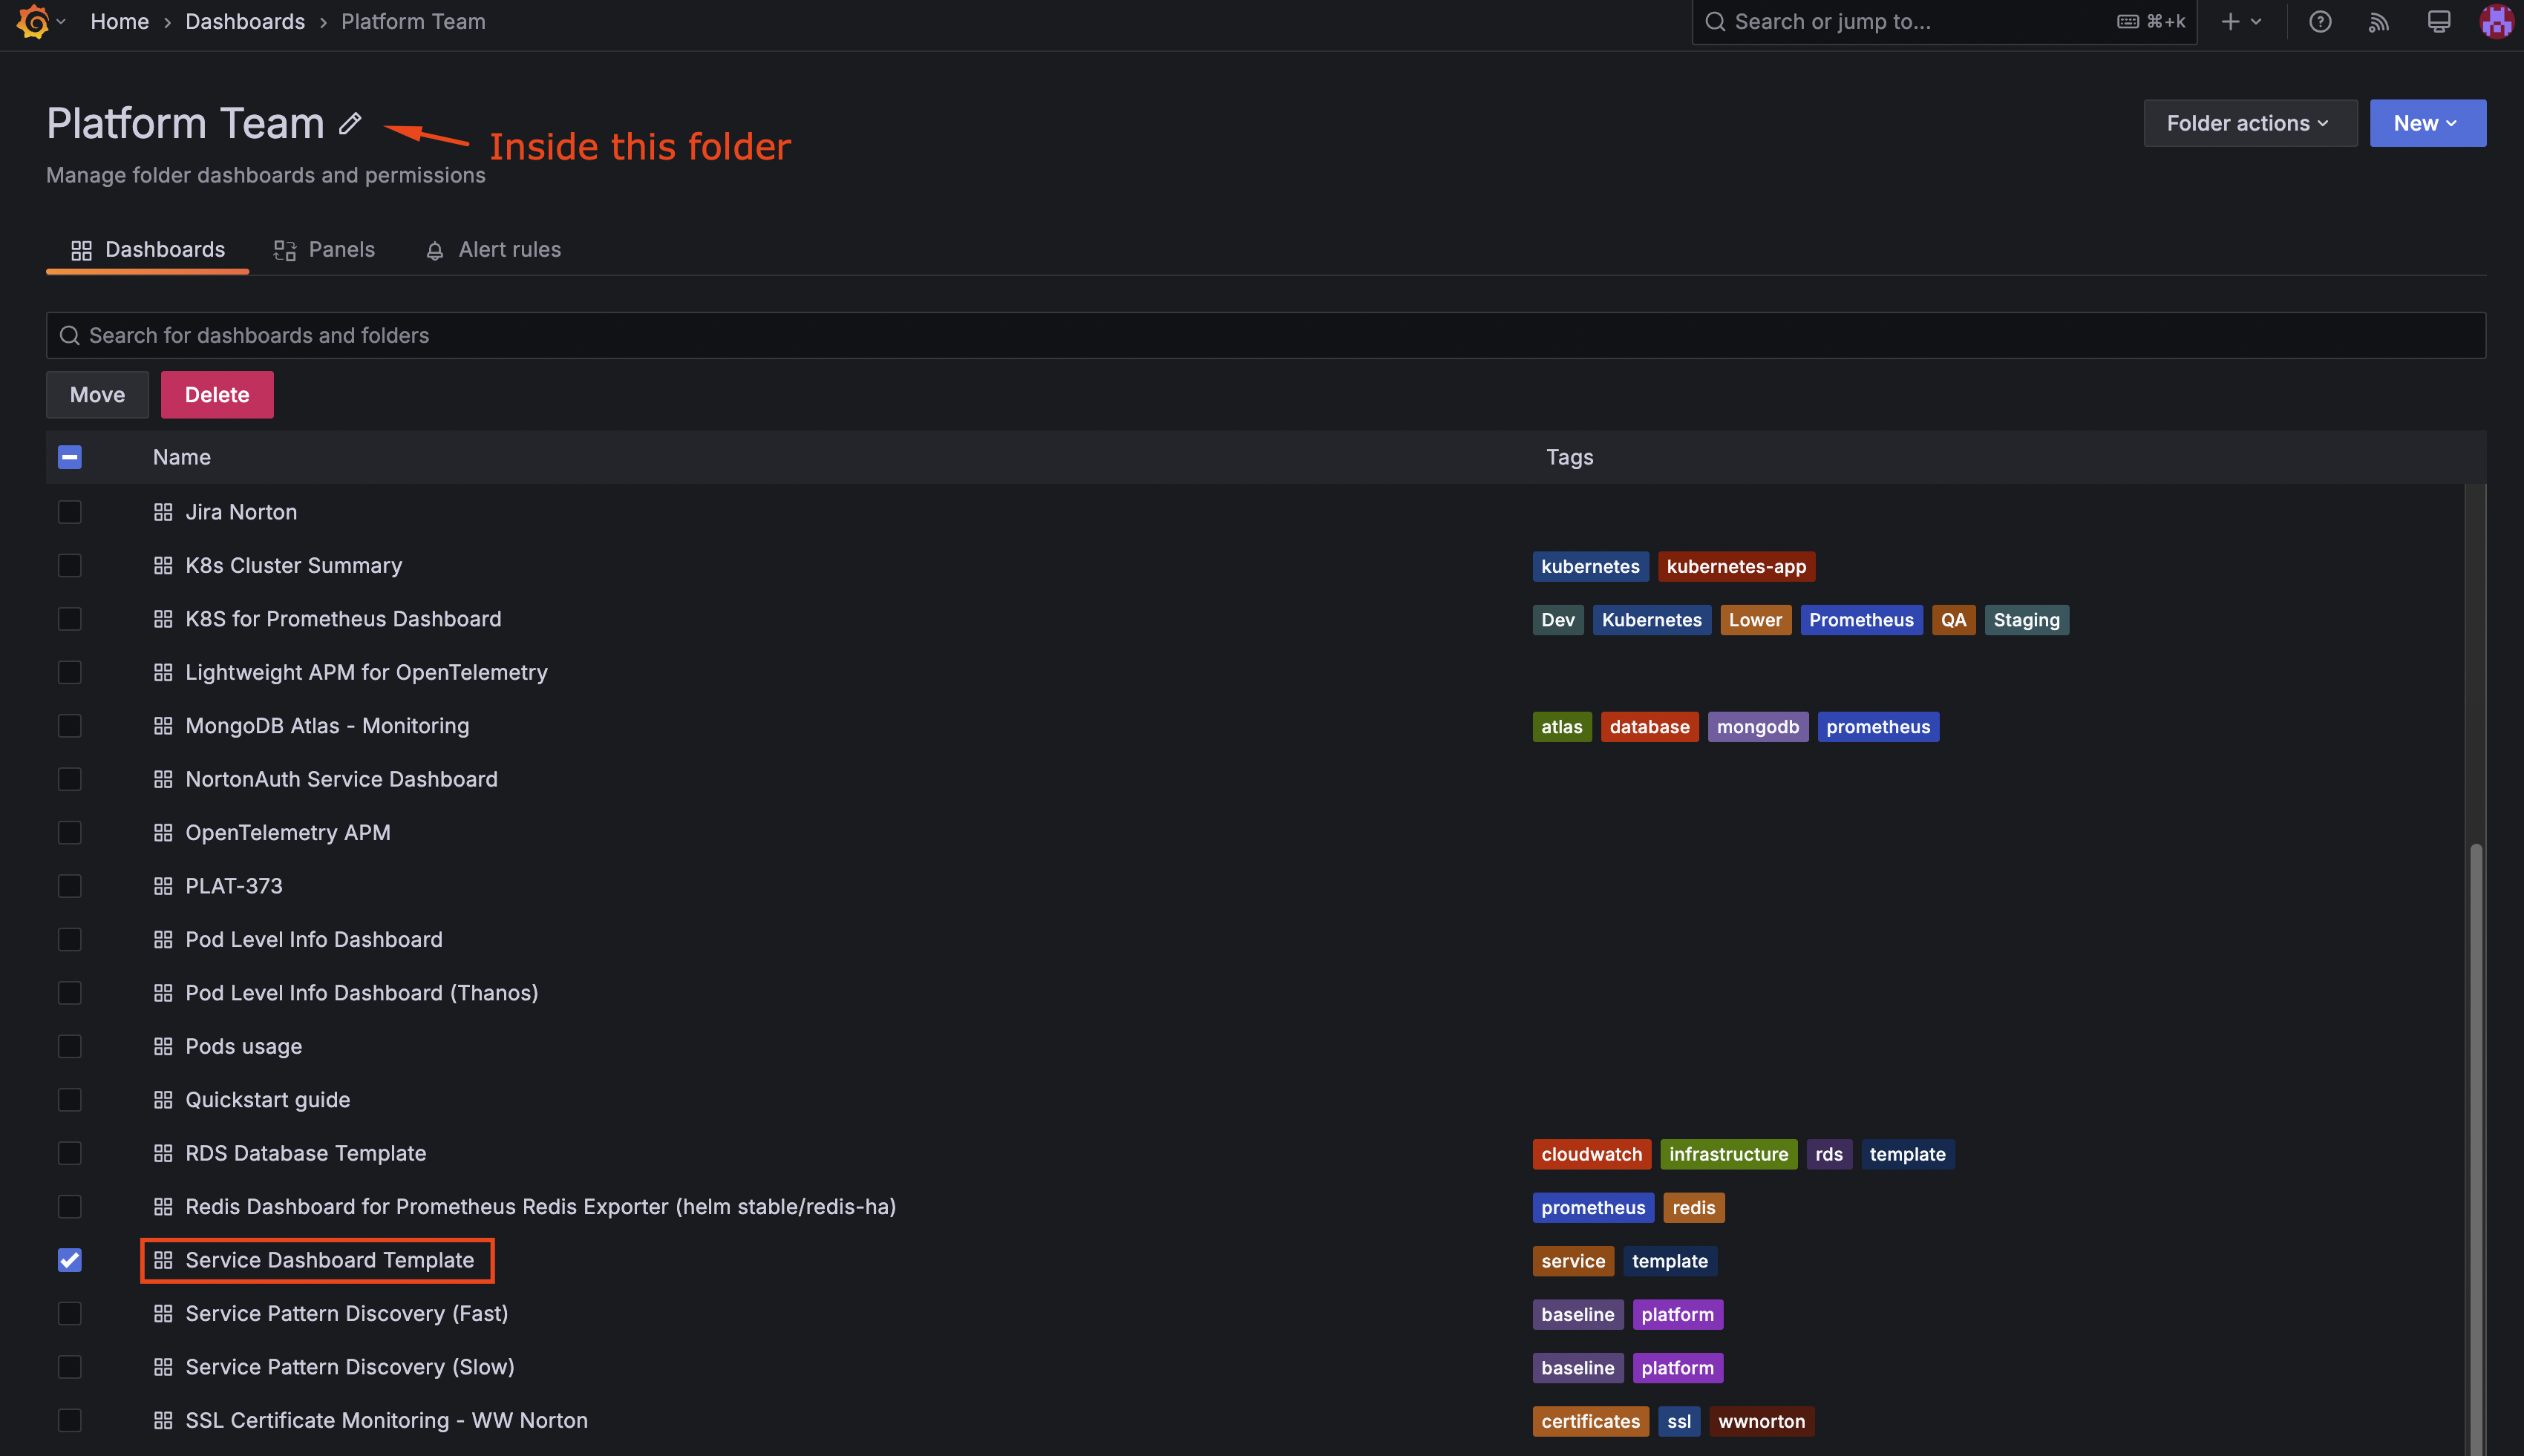
Step 1: Open the Service Dashboard Template
Navigate to: Dashboards → Platform Team → Service Dashboard Template
Or use this direct link: Service Dashboard Template
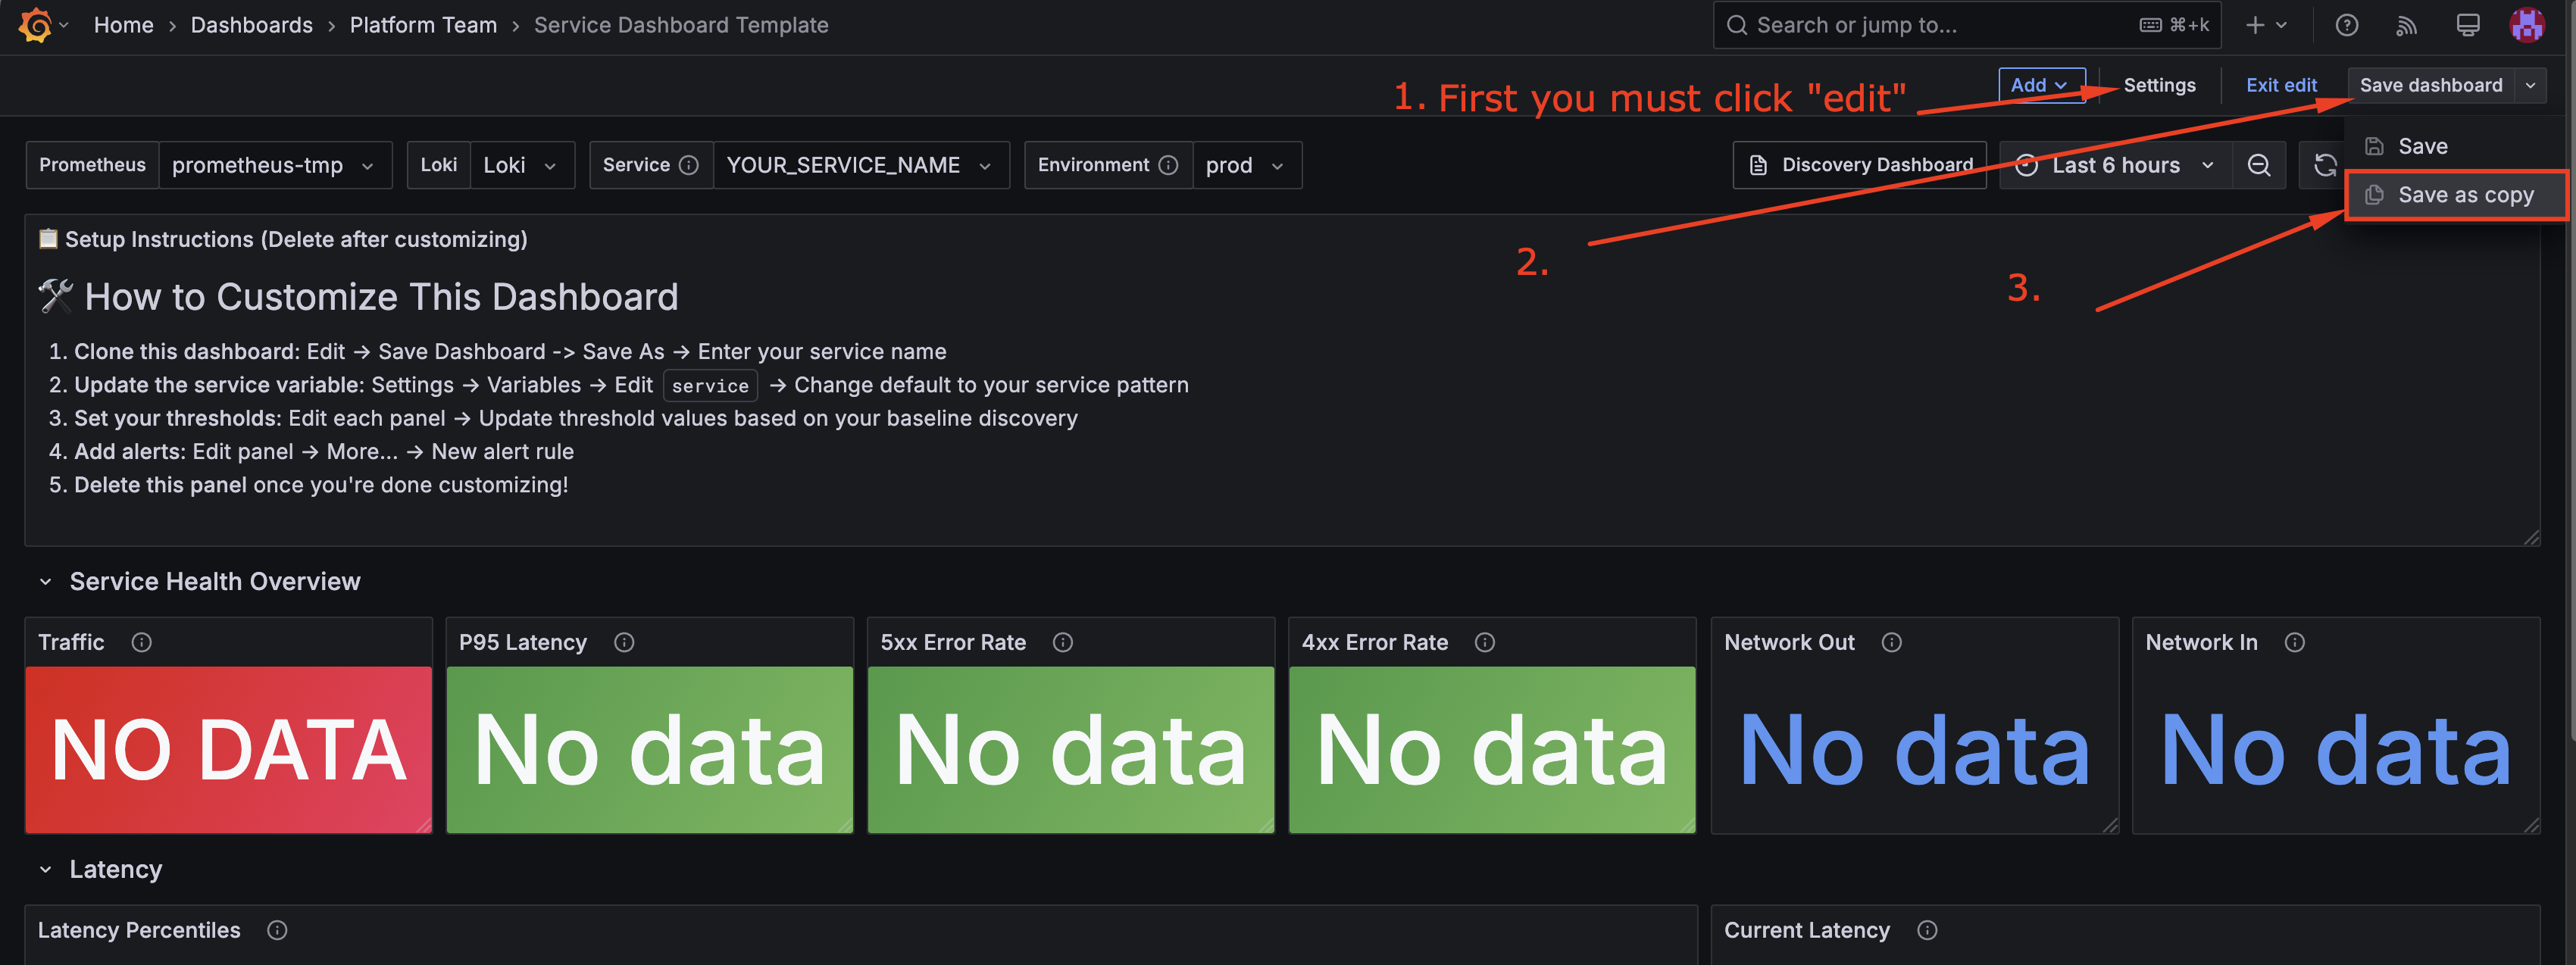
Step 2: Clone the Dashboard
- Click the Settings icon (gear) in the top-right corner
- Click "Save As..."
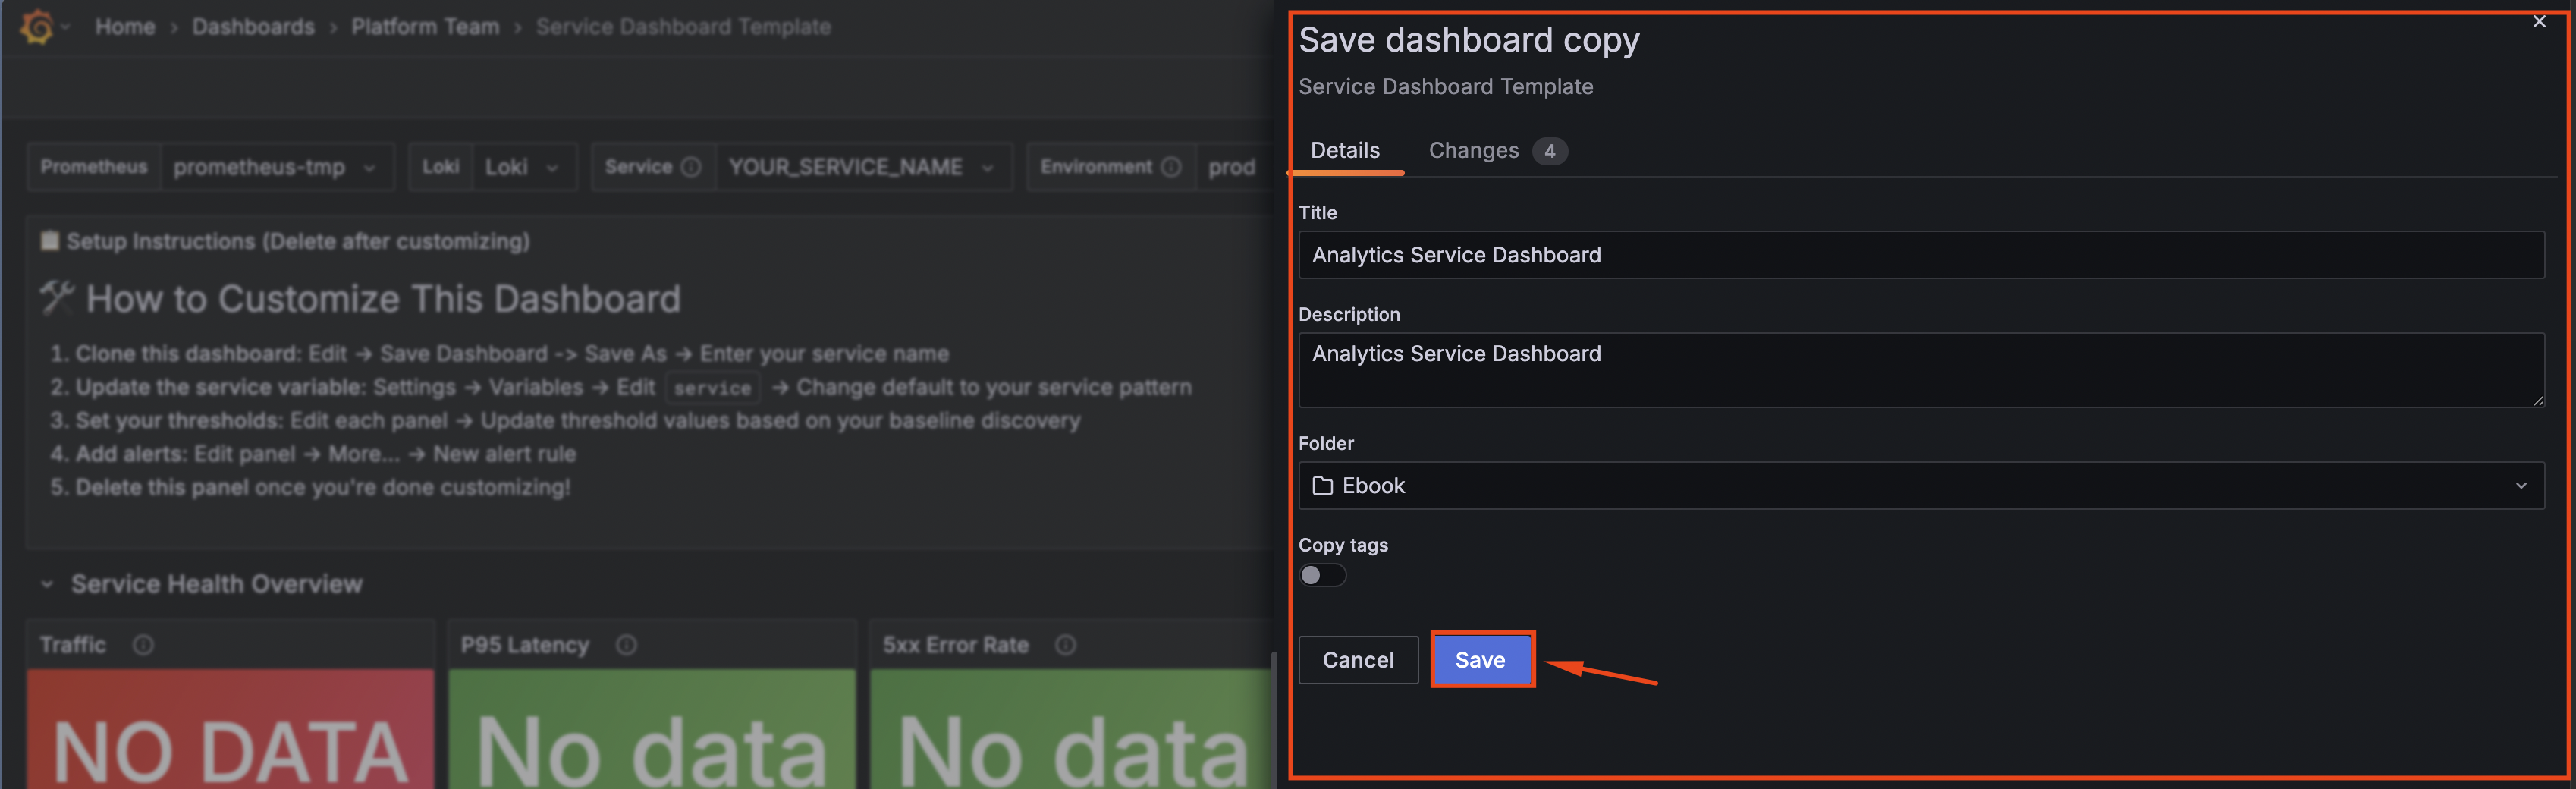
- Enter a name for your dashboard:
[ServiceName] Service Dashboard- Example:
Analytics Service Dashboard
- Example:
- Select your team's folder from the dropdown
- Click Save
Why clone instead of edit? The template is shared. If you modify it directly, you'll break it for everyone else. Always clone first, then customize your copy.
Step 3: Update the Service Variable Default
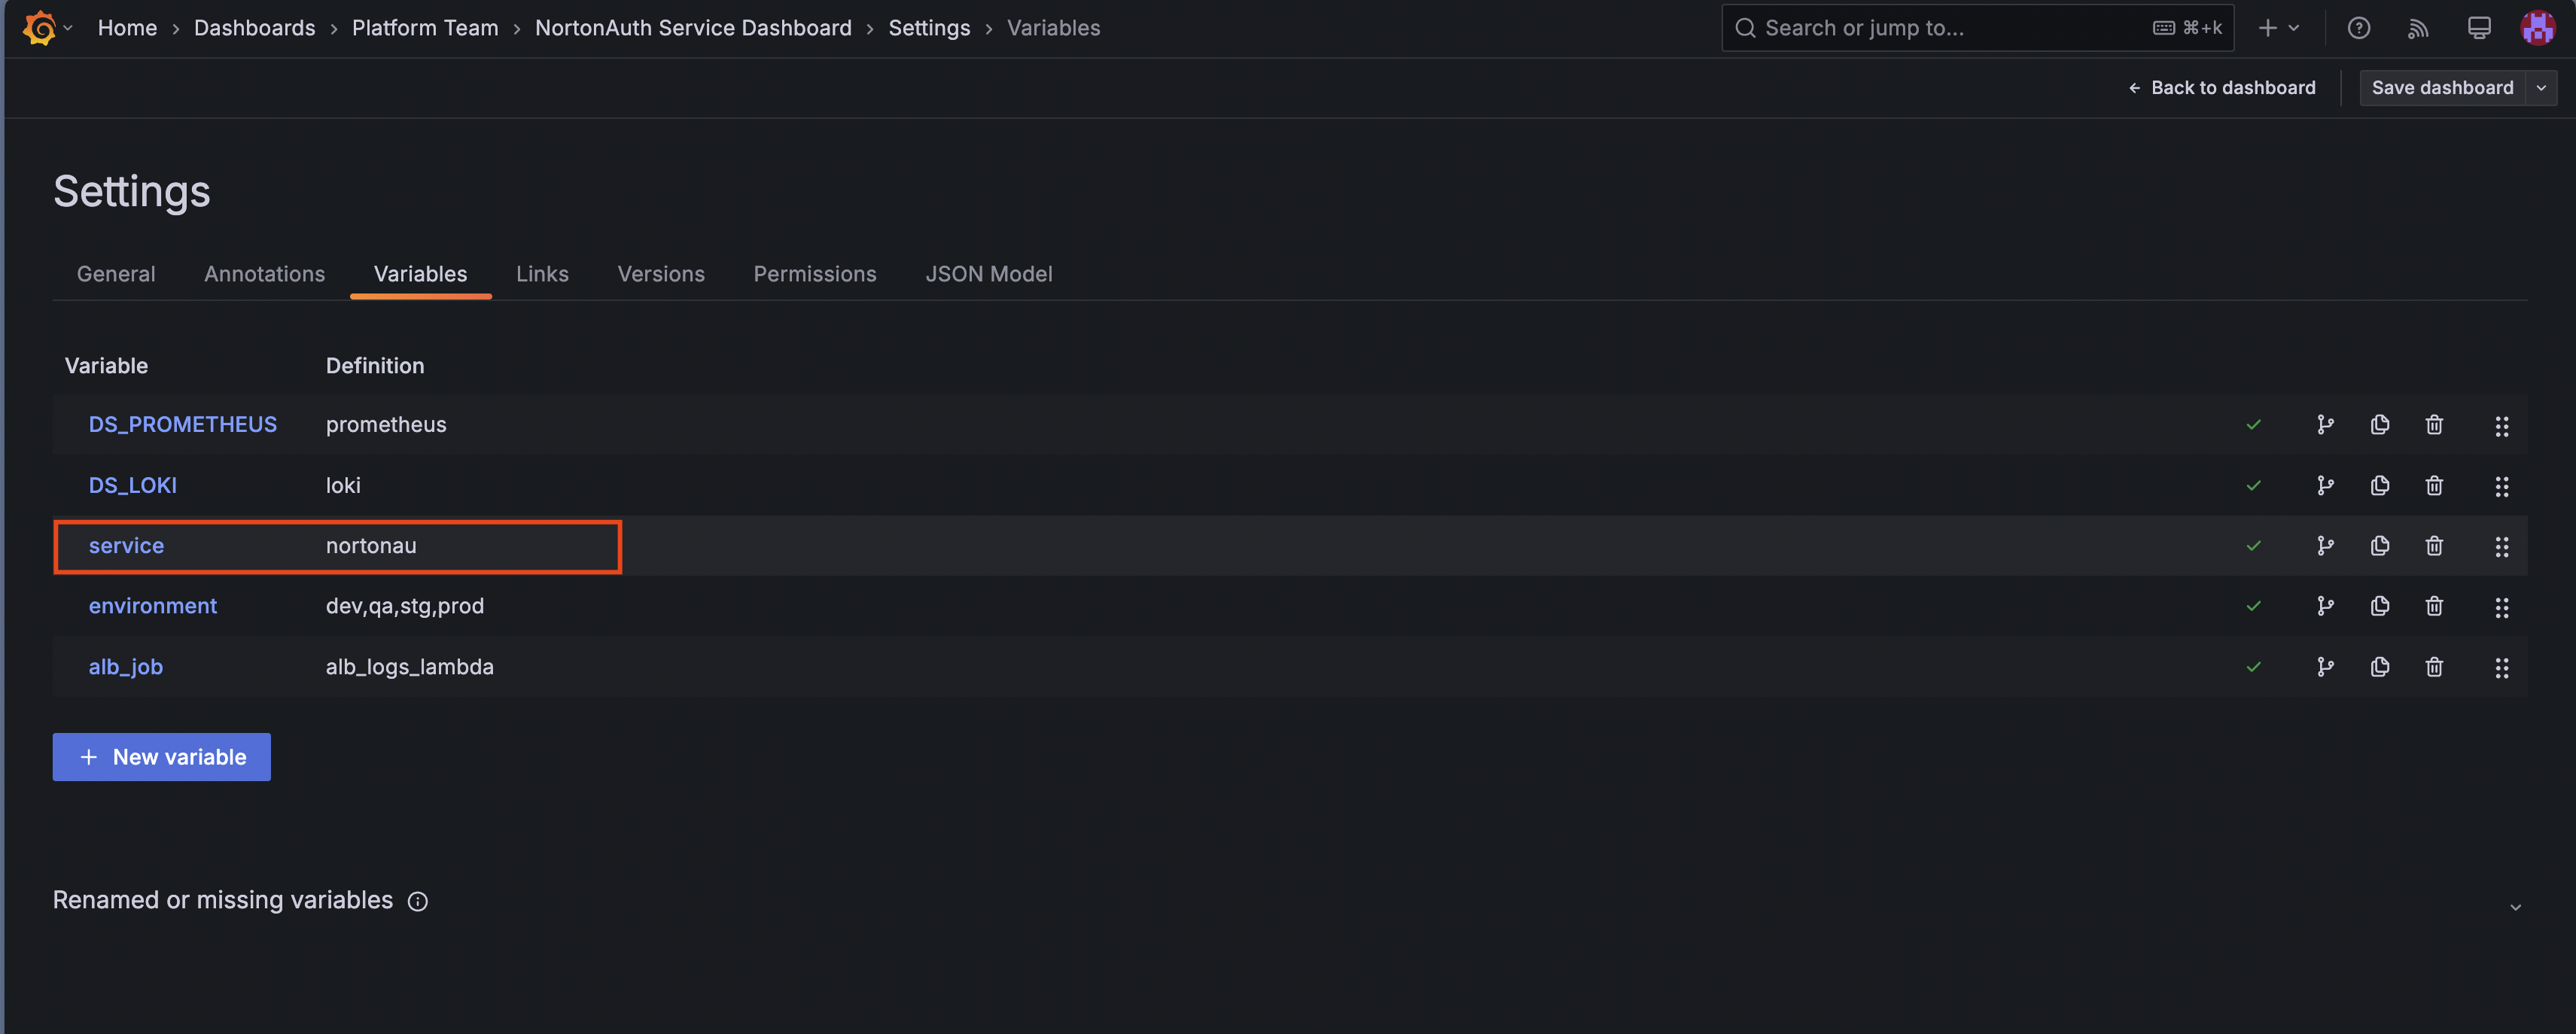
Your cloned dashboard still has placeholder values. Let's fix that.
- Click Settings (gear icon) → Variables
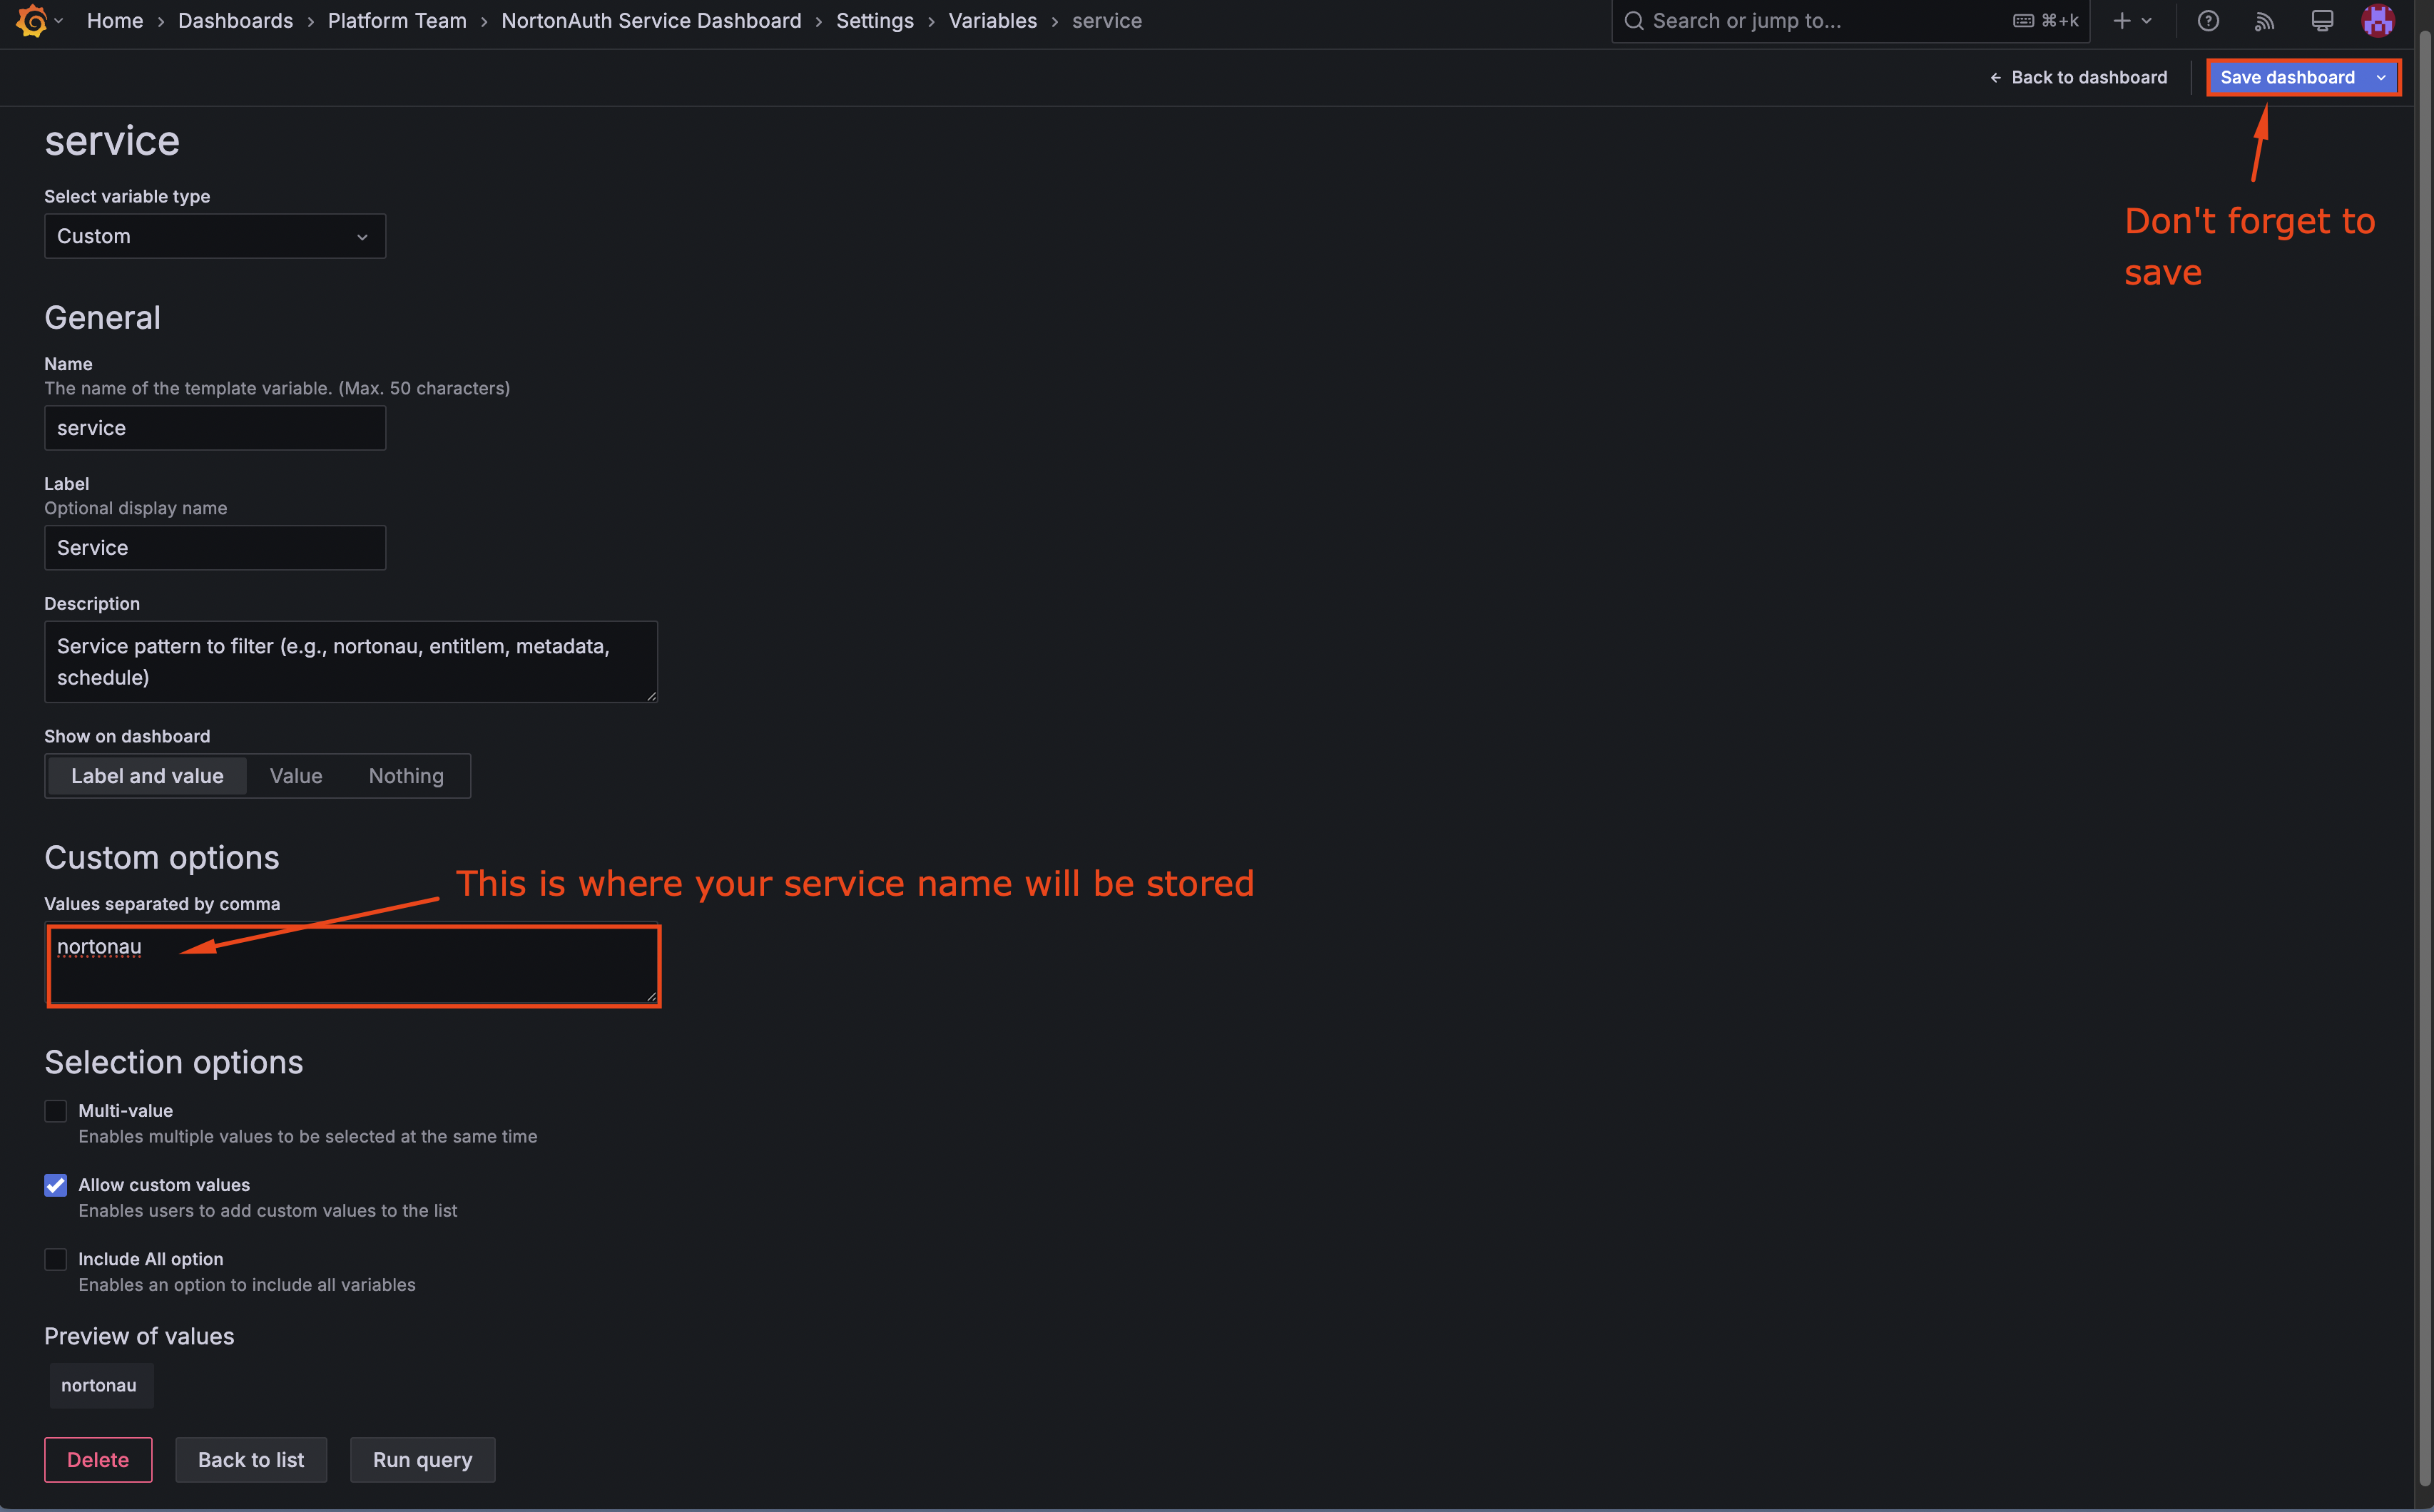
- Find the
servicevariable and click on it - Update the default value to your service pattern
- Click Update, then Save dashboard
Step 4: Verify Data Appears
Go back to the dashboard view. All panels should now show data for your service. If any panels show "No data":
- Check that your service pattern is correct
- Verify the environment variable matches where your service runs
- Confirm the time range includes recent data
Step 5: Configure Panel Thresholds
This is where your baseline analysis pays off. For each key panel, you'll add visual thresholds that color the graph based on value ranges.
For the Request Rate panel:
- Click the panel title → Edit
- In the right sidebar, find Thresholds
- Add thresholds based on your baseline:
- Base (green): Up to your normal max
- Yellow: Above your "spike" threshold
- Red: Significantly above normal (potential incident)
- Click Apply
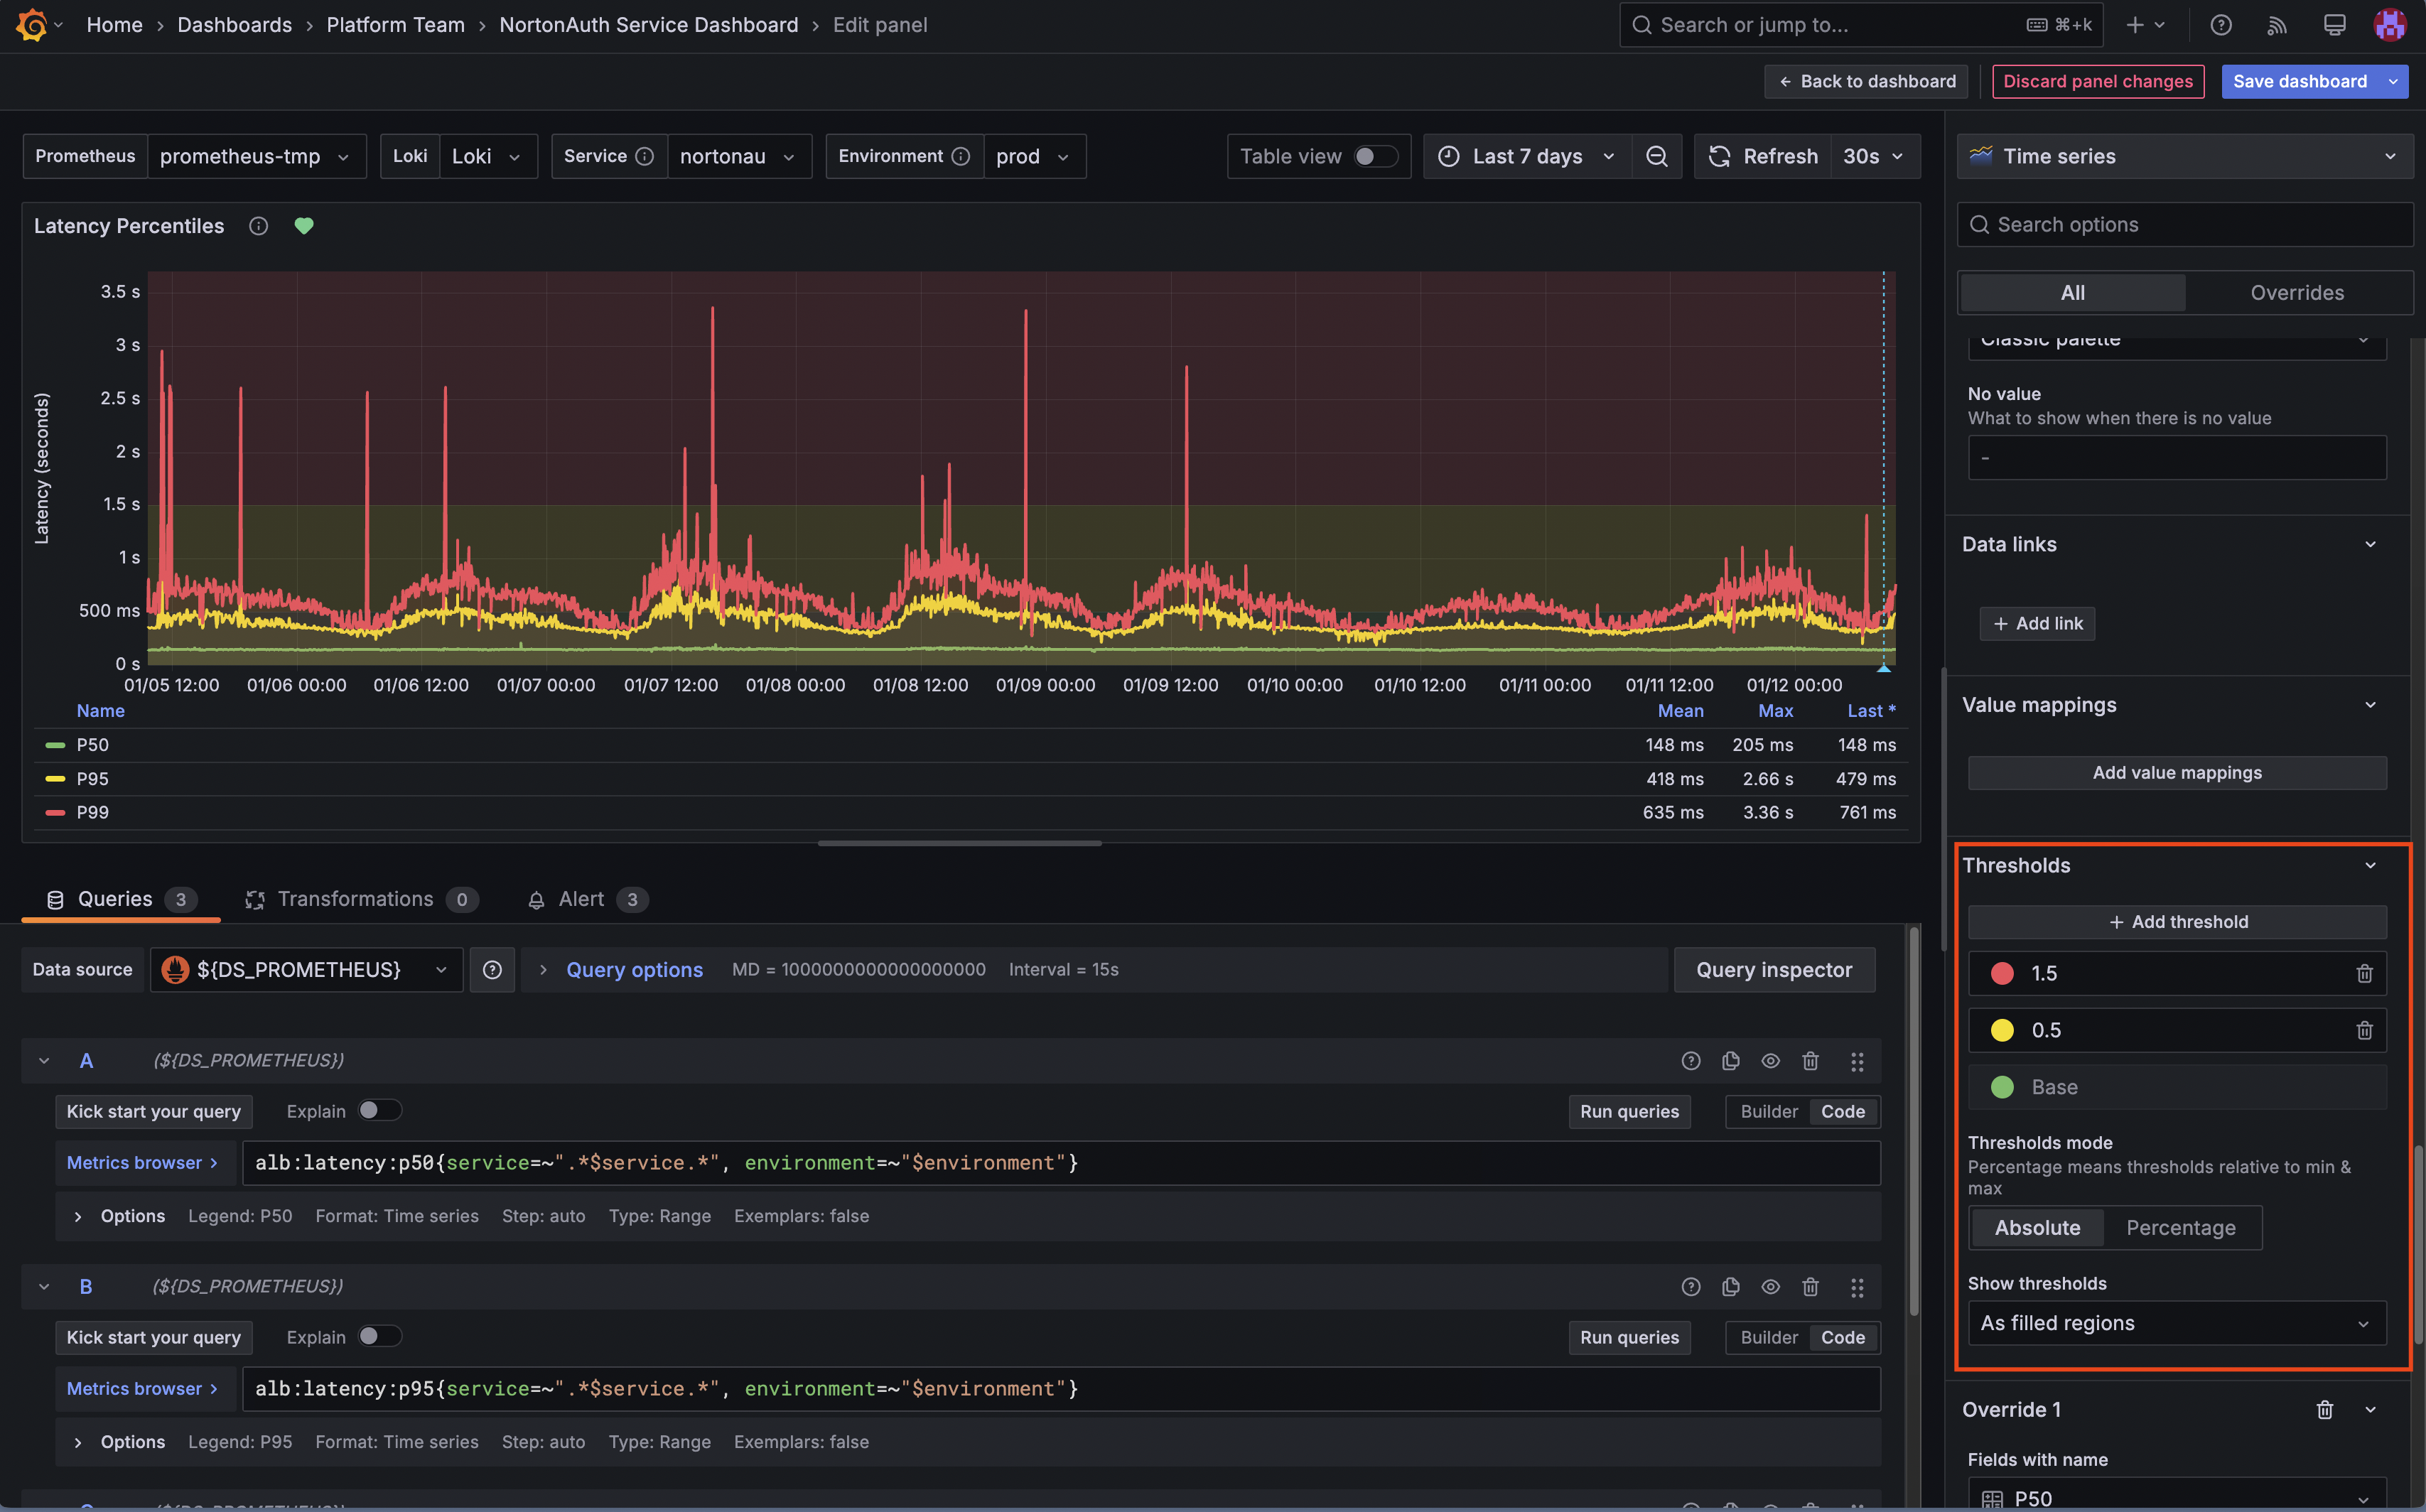
For the P95 Latency panel:
- Edit the panel
- Add thresholds:
- Green: Below your warning threshold
- Yellow: Between warning and critical
- Red: Above critical threshold
- Apply changes
Repeat for Error Rate panels with appropriate thresholds from your analysis.
Step 6: Remove the Setup Instructions Panel
The template includes an instructional panel at the top that you no longer need.
- Hover over the "Setup Instructions" panel
- Click the panel menu (three dots)
- Select Remove
- Save the dashboard
Step 7: Save and Share
- Click Save dashboard
- Optionally, star the dashboard for quick access
- Share the dashboard link with your team
Phase 3: Creating Alert Rules
Dashboards show you what's happening now. Alerts tell you when something's wrong even when you're not looking. Let's create alerts based on your baselines.
Understanding Alert Structure
Before we create alerts, here's how Grafana alerts work:
- Query: Fetches the metric data (same queries your dashboard uses)
- Expression: Reduces the data to a single value and applies conditions
- Evaluation: How often to check and how long a condition must persist
- Notification: Where to send the alert
Step 1: Create a Service Down Alert
This is your most critical alert. Zero traffic almost always means something is broken.
- Navigate to Alerting → Alert rules
- Click + New alert rule
- Configure the alert:
Rule name: Service Down - [YourServiceName]
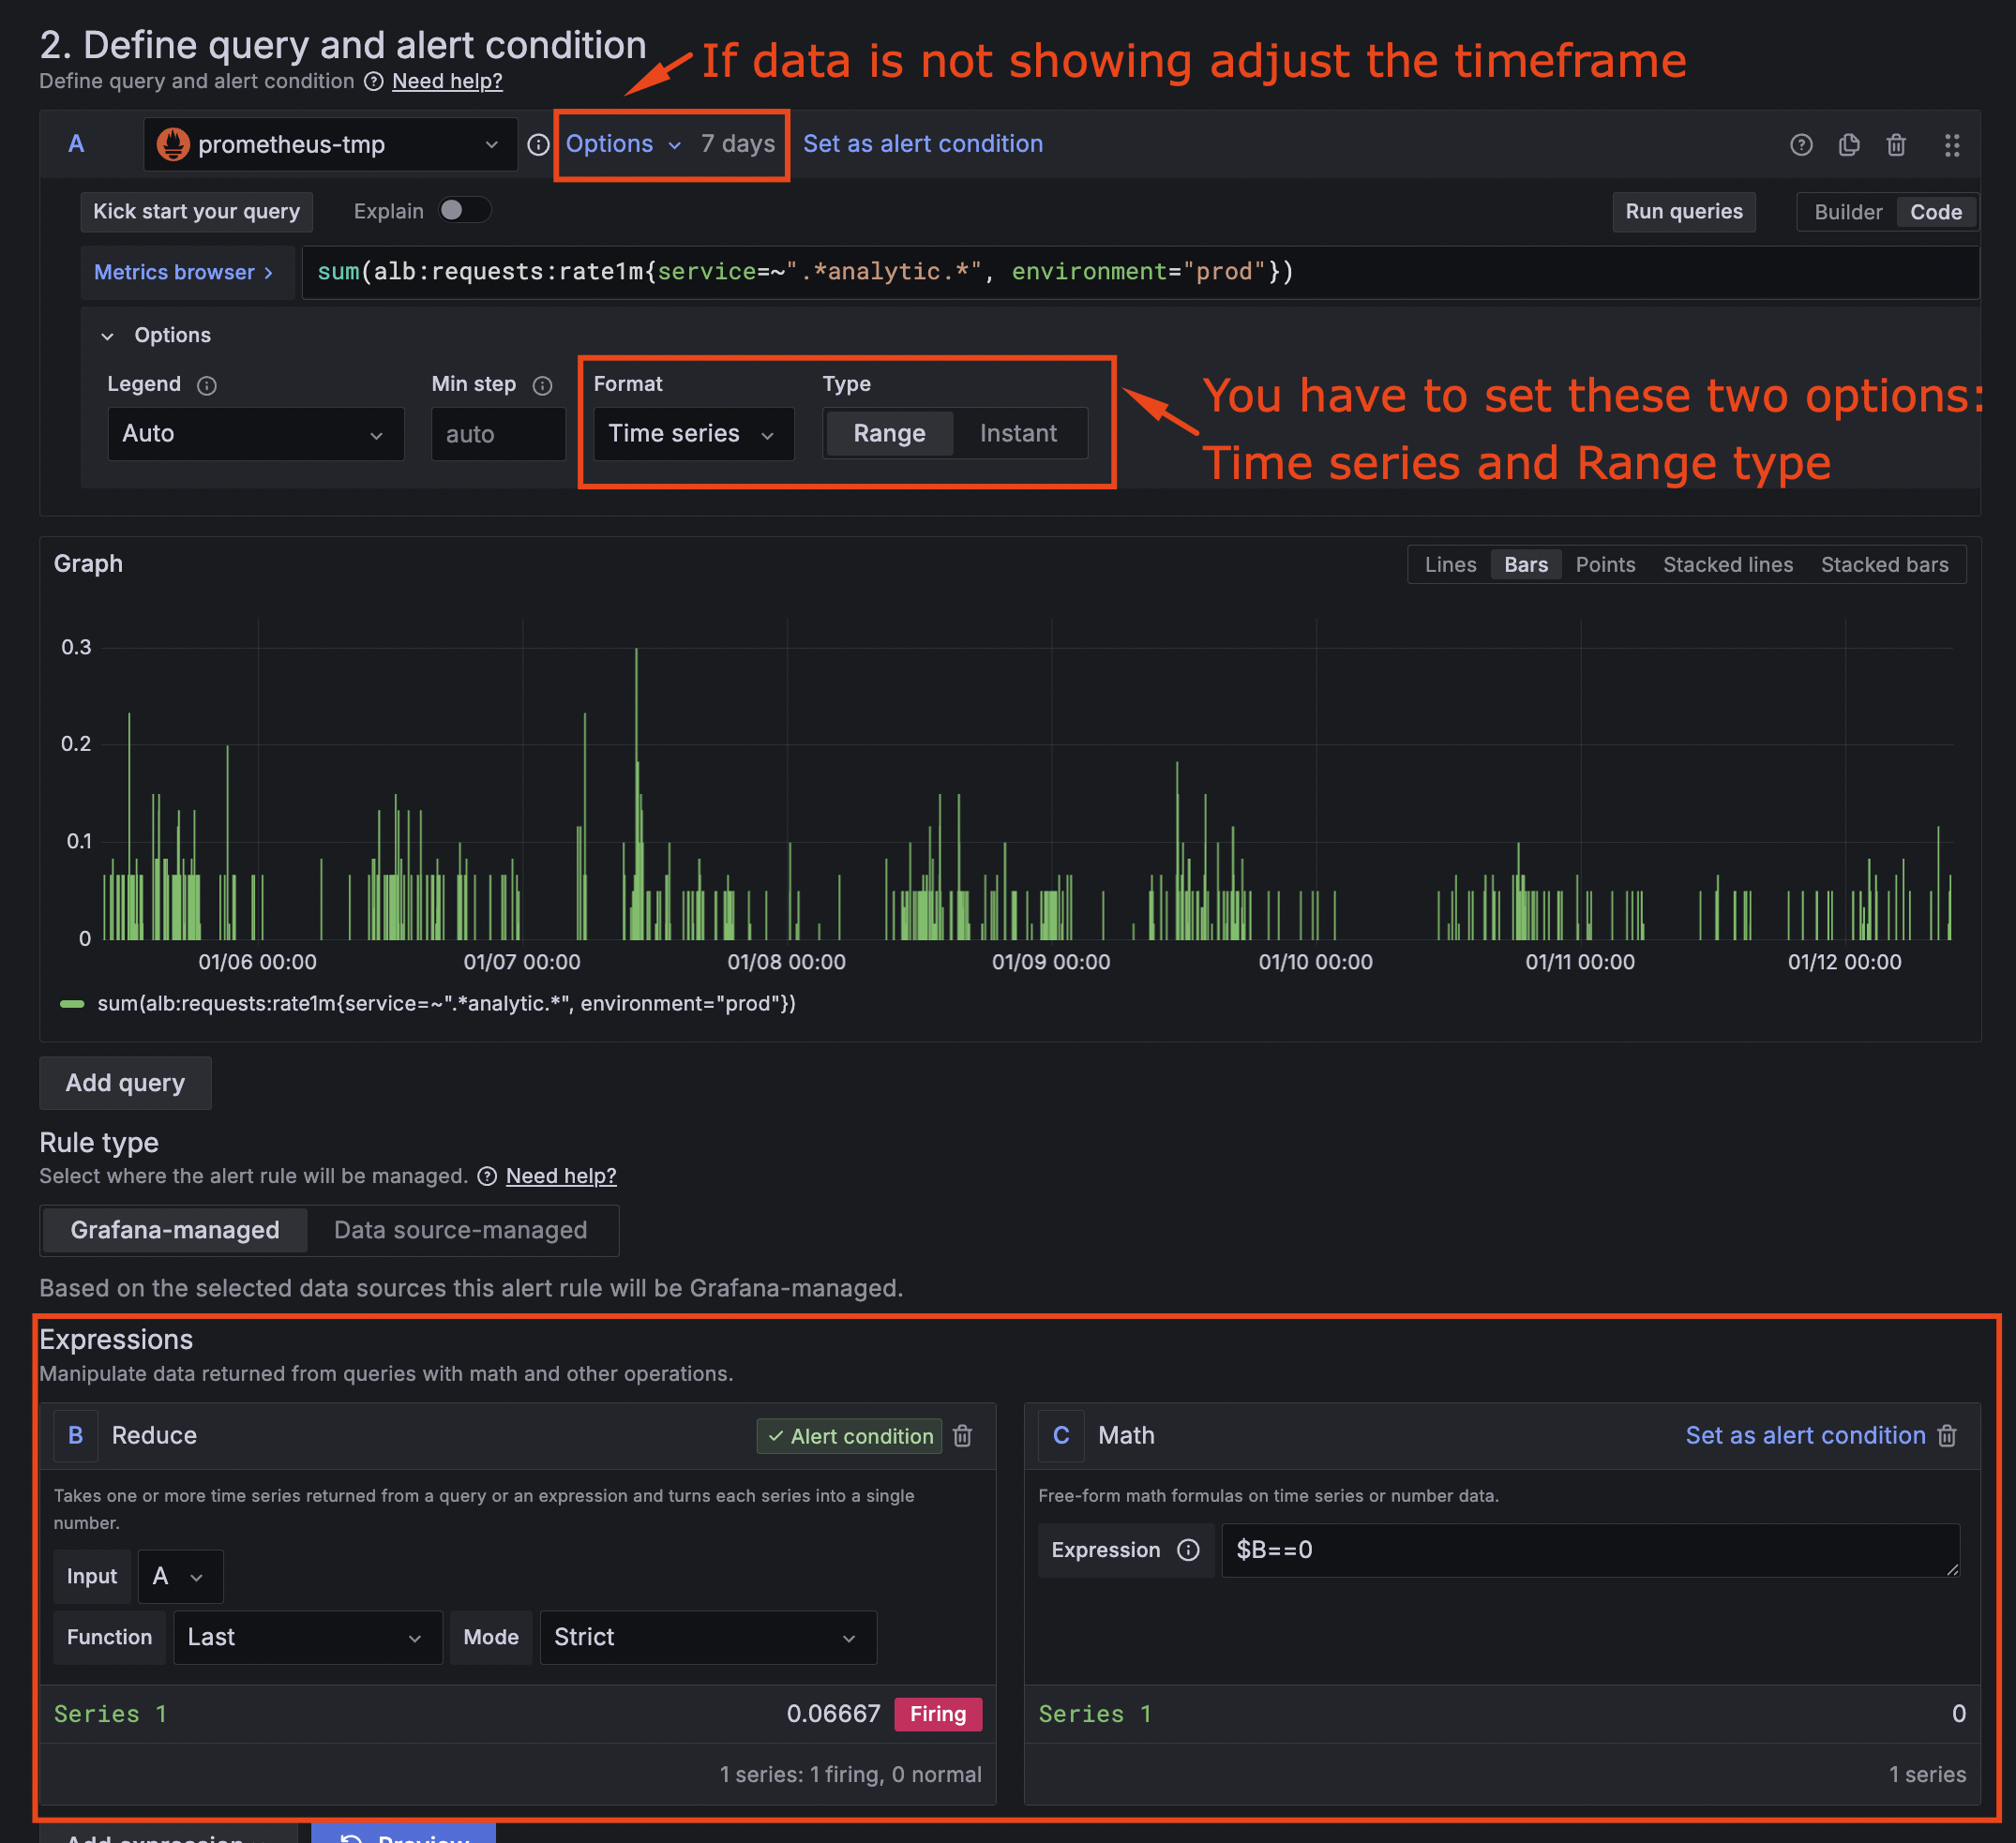
Query A:
sum(alb:requests:rate1m{service=~".*YOUR_SERVICE.*", environment="prod"})
-
Add a Reduce expression:
- Expression: B
- Function: Last
- Input: A
- Mode: Strict
-
Add a Math expression:
- Expression:
$B == 0
- Expression:
-
Set evaluation behavior:
- Folder: Select or create your team's alert folder
- Evaluation group: Create a new group or use existing
- Pending period:
3m(fires after 3 minutes of zero traffic)
-
Add annotations:
- Summary:
[YourServiceName] is not receiving any traffic - Description:
No requests have been recorded for the past 3 minutes. The service may be down or unreachable.
- Summary:
-
Add labels:
severity: critical
-
Configure notifications:
- Select your team's notification channel
-
Click Save rule and exit
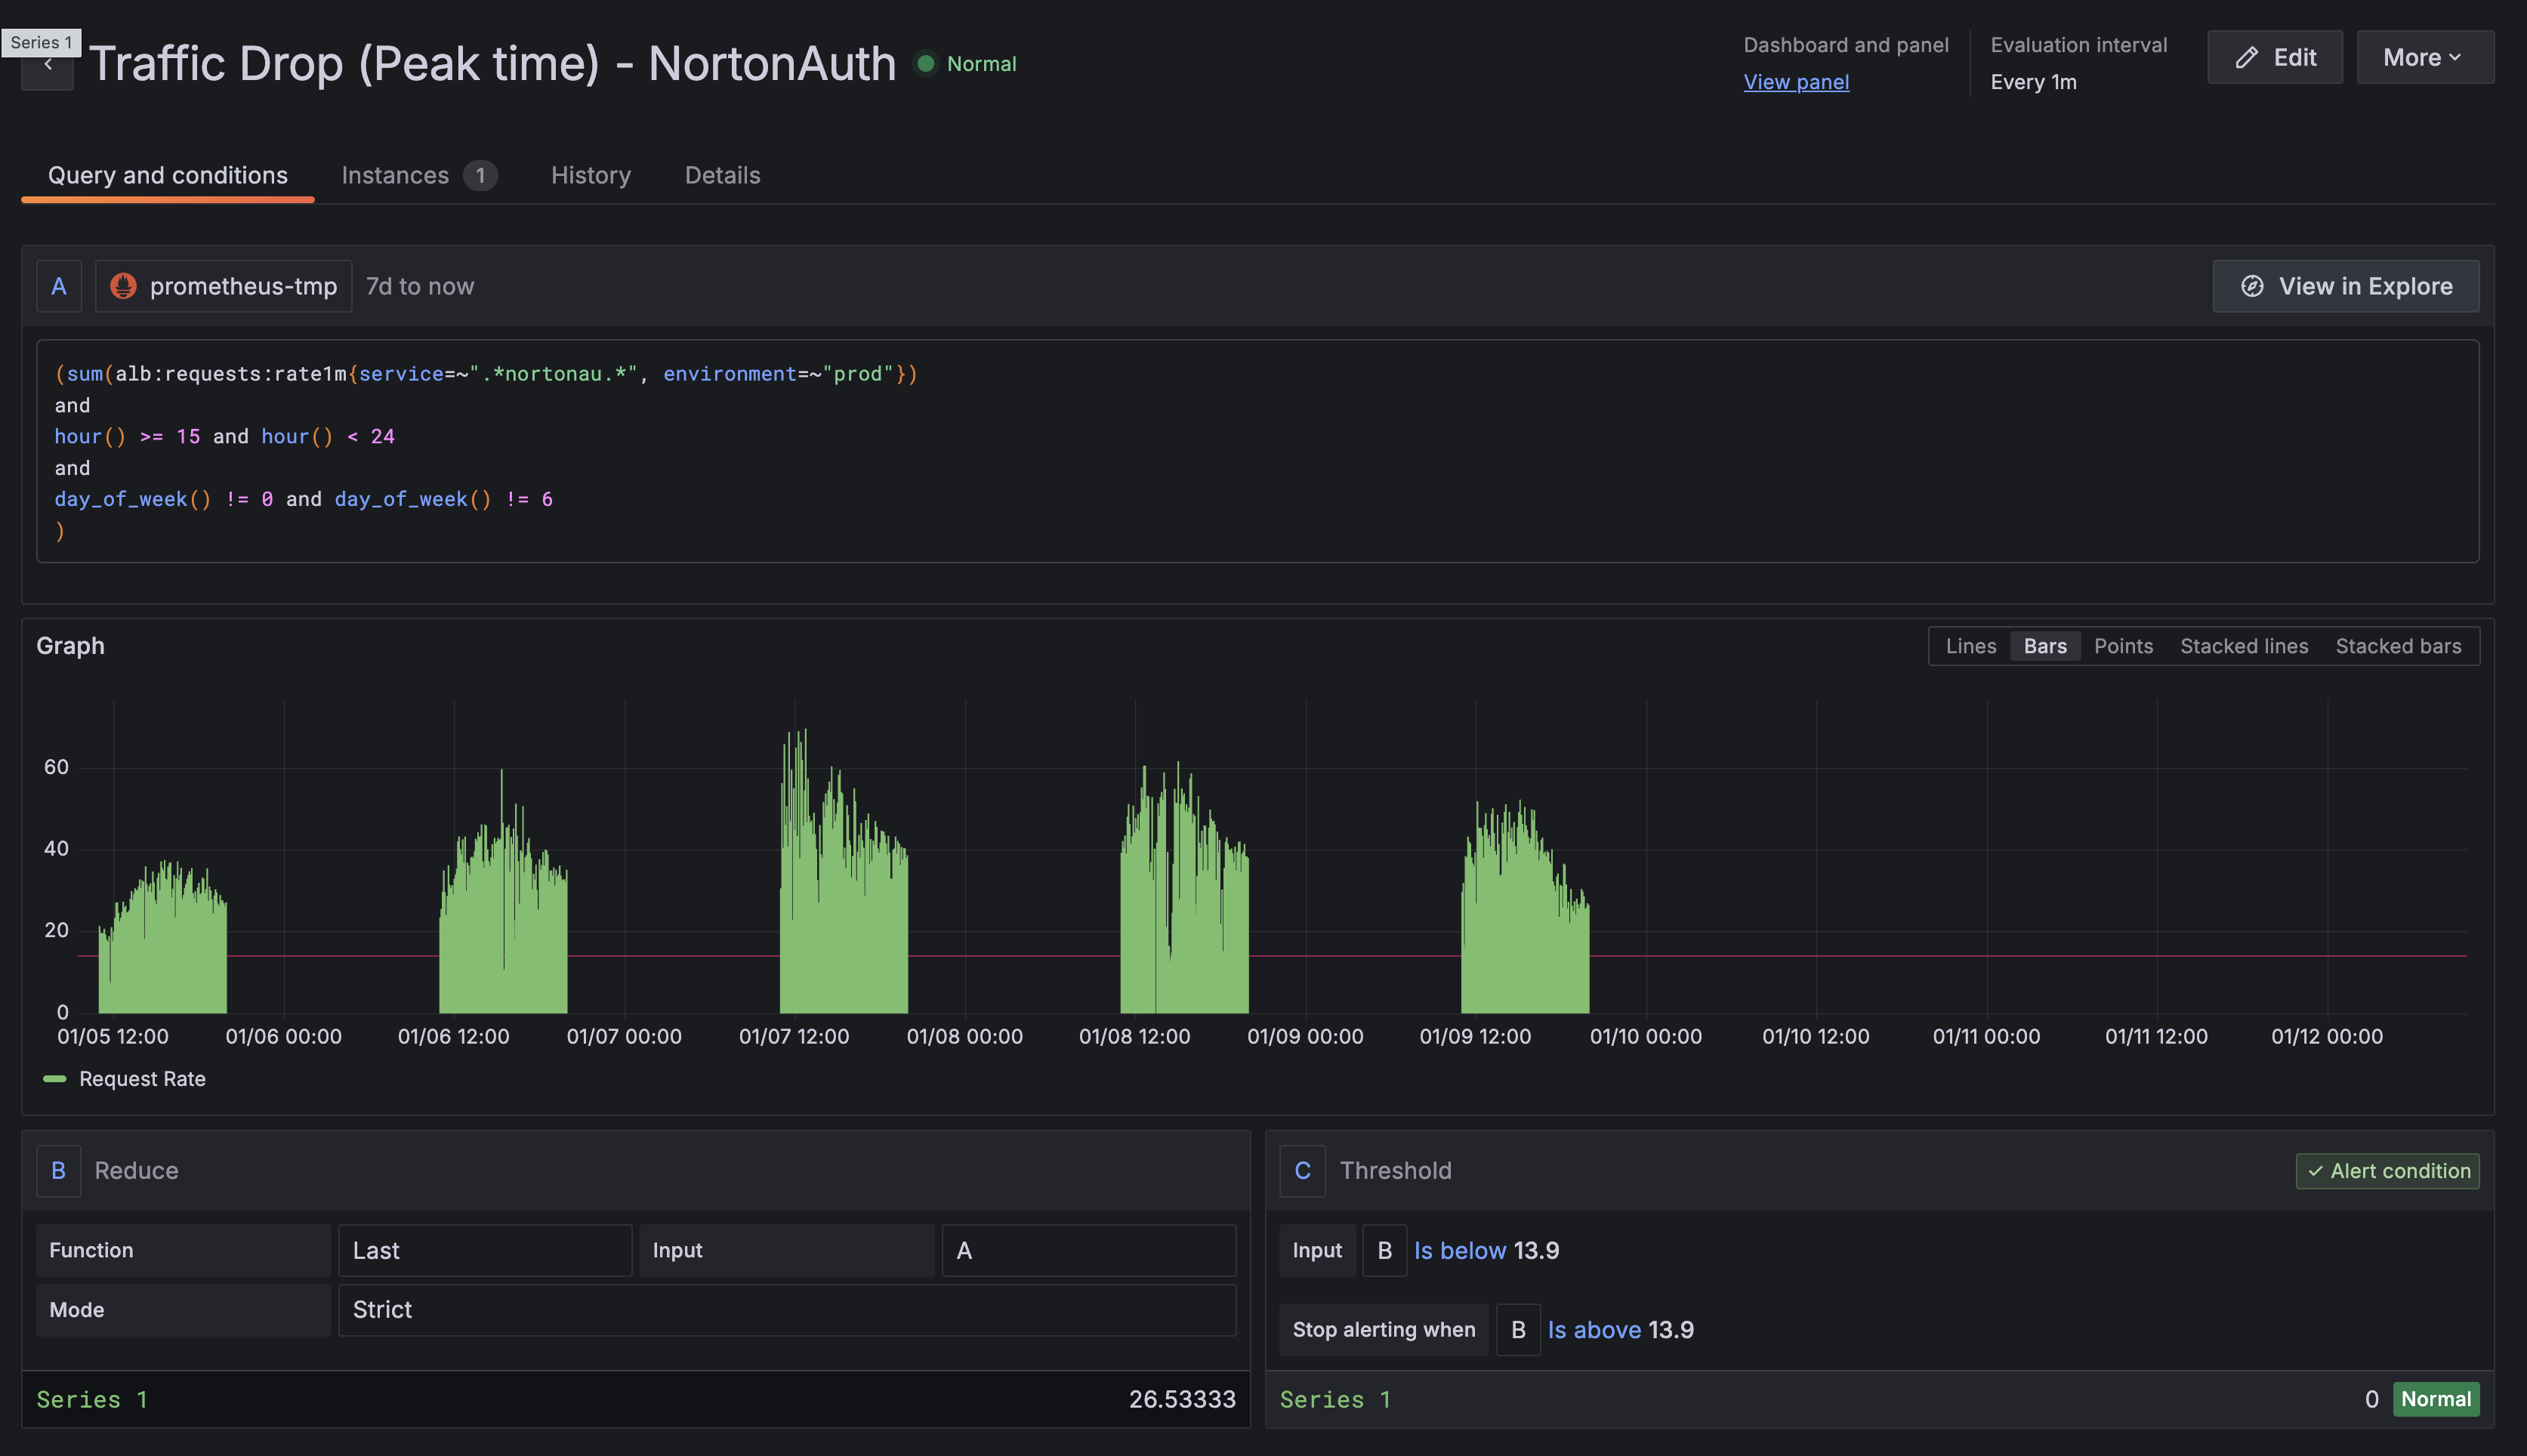
Step 2: Create a Traffic Drop Alert (Peak Hours)
This alert detects when traffic drops below expected levels during business hours. We'll use time-based filtering to avoid false positives overnight.
Rule name: Traffic Drop (Peak Hours) - [YourServiceName]
Query A:
(
  sum(alb:requests:rate1m{service=~".*YOUR_SERVICE.*", environment="prod"})
  and
  hour() >= 9 and hour() < 18
  and
  day_of_week() != 0 and day_of_week() != 6
)
Understanding the time filter:
hour() >= 9 and hour() < 18— Only evaluate between 9 AM and 6 PM UTCday_of_week() != 0 and day_of_week() != 6— Exclude Sunday (0) and Saturday (6)
Adjust these to match your service's expected traffic patterns and timezone.
Expressions:
- Reduce: Last value of A
- Threshold: IS BELOW
[your traffic drop threshold from baseline]
Pending period: 10m — Traffic dips happen; wait 10 minutes to confirm it's sustained.
Severity: warning
Step 3: Create a P95 Latency Warning Alert
Rule name: P95 Latency Warning - [YourServiceName]
Query A:
alb:latency:p95{service=~".*YOUR_SERVICE.*", environment="prod"}
Expressions:
- Reduce: Last value of A
- Threshold: IS ABOVE
[your P95 warning threshold, e.g., 0.5 for 500ms]
Latency is in seconds, not milliseconds. The ALB logs record response time in seconds. A 500ms threshold is 0.5, not 500.
Pending period: 10m
Severity: warning
Step 4: Create a P95 Latency Critical Alert
Same as above, but with a higher threshold and shorter pending period.
Rule name: P95 Latency Critical - [YourServiceName]
Threshold: IS ABOVE [your P95 critical threshold, e.g., 1.5 for 1.5s]
Pending period: 5m — Faster notification for severe degradation
Severity: critical
Step 5: Create Error Rate Alerts
Rule name: Error Rate Warning - [YourServiceName]
Query A:
alb:error_rate_5xx:percent{service=~".*YOUR_SERVICE.*", environment="prod"}
Threshold: IS ABOVE 1 (1% error rate)
Pending period: 10m
Severity: warning
Rule name: Error Rate Critical - [YourServiceName]
Threshold: IS ABOVE 5 (5% error rate)
Pending period: 5m
Severity: critical
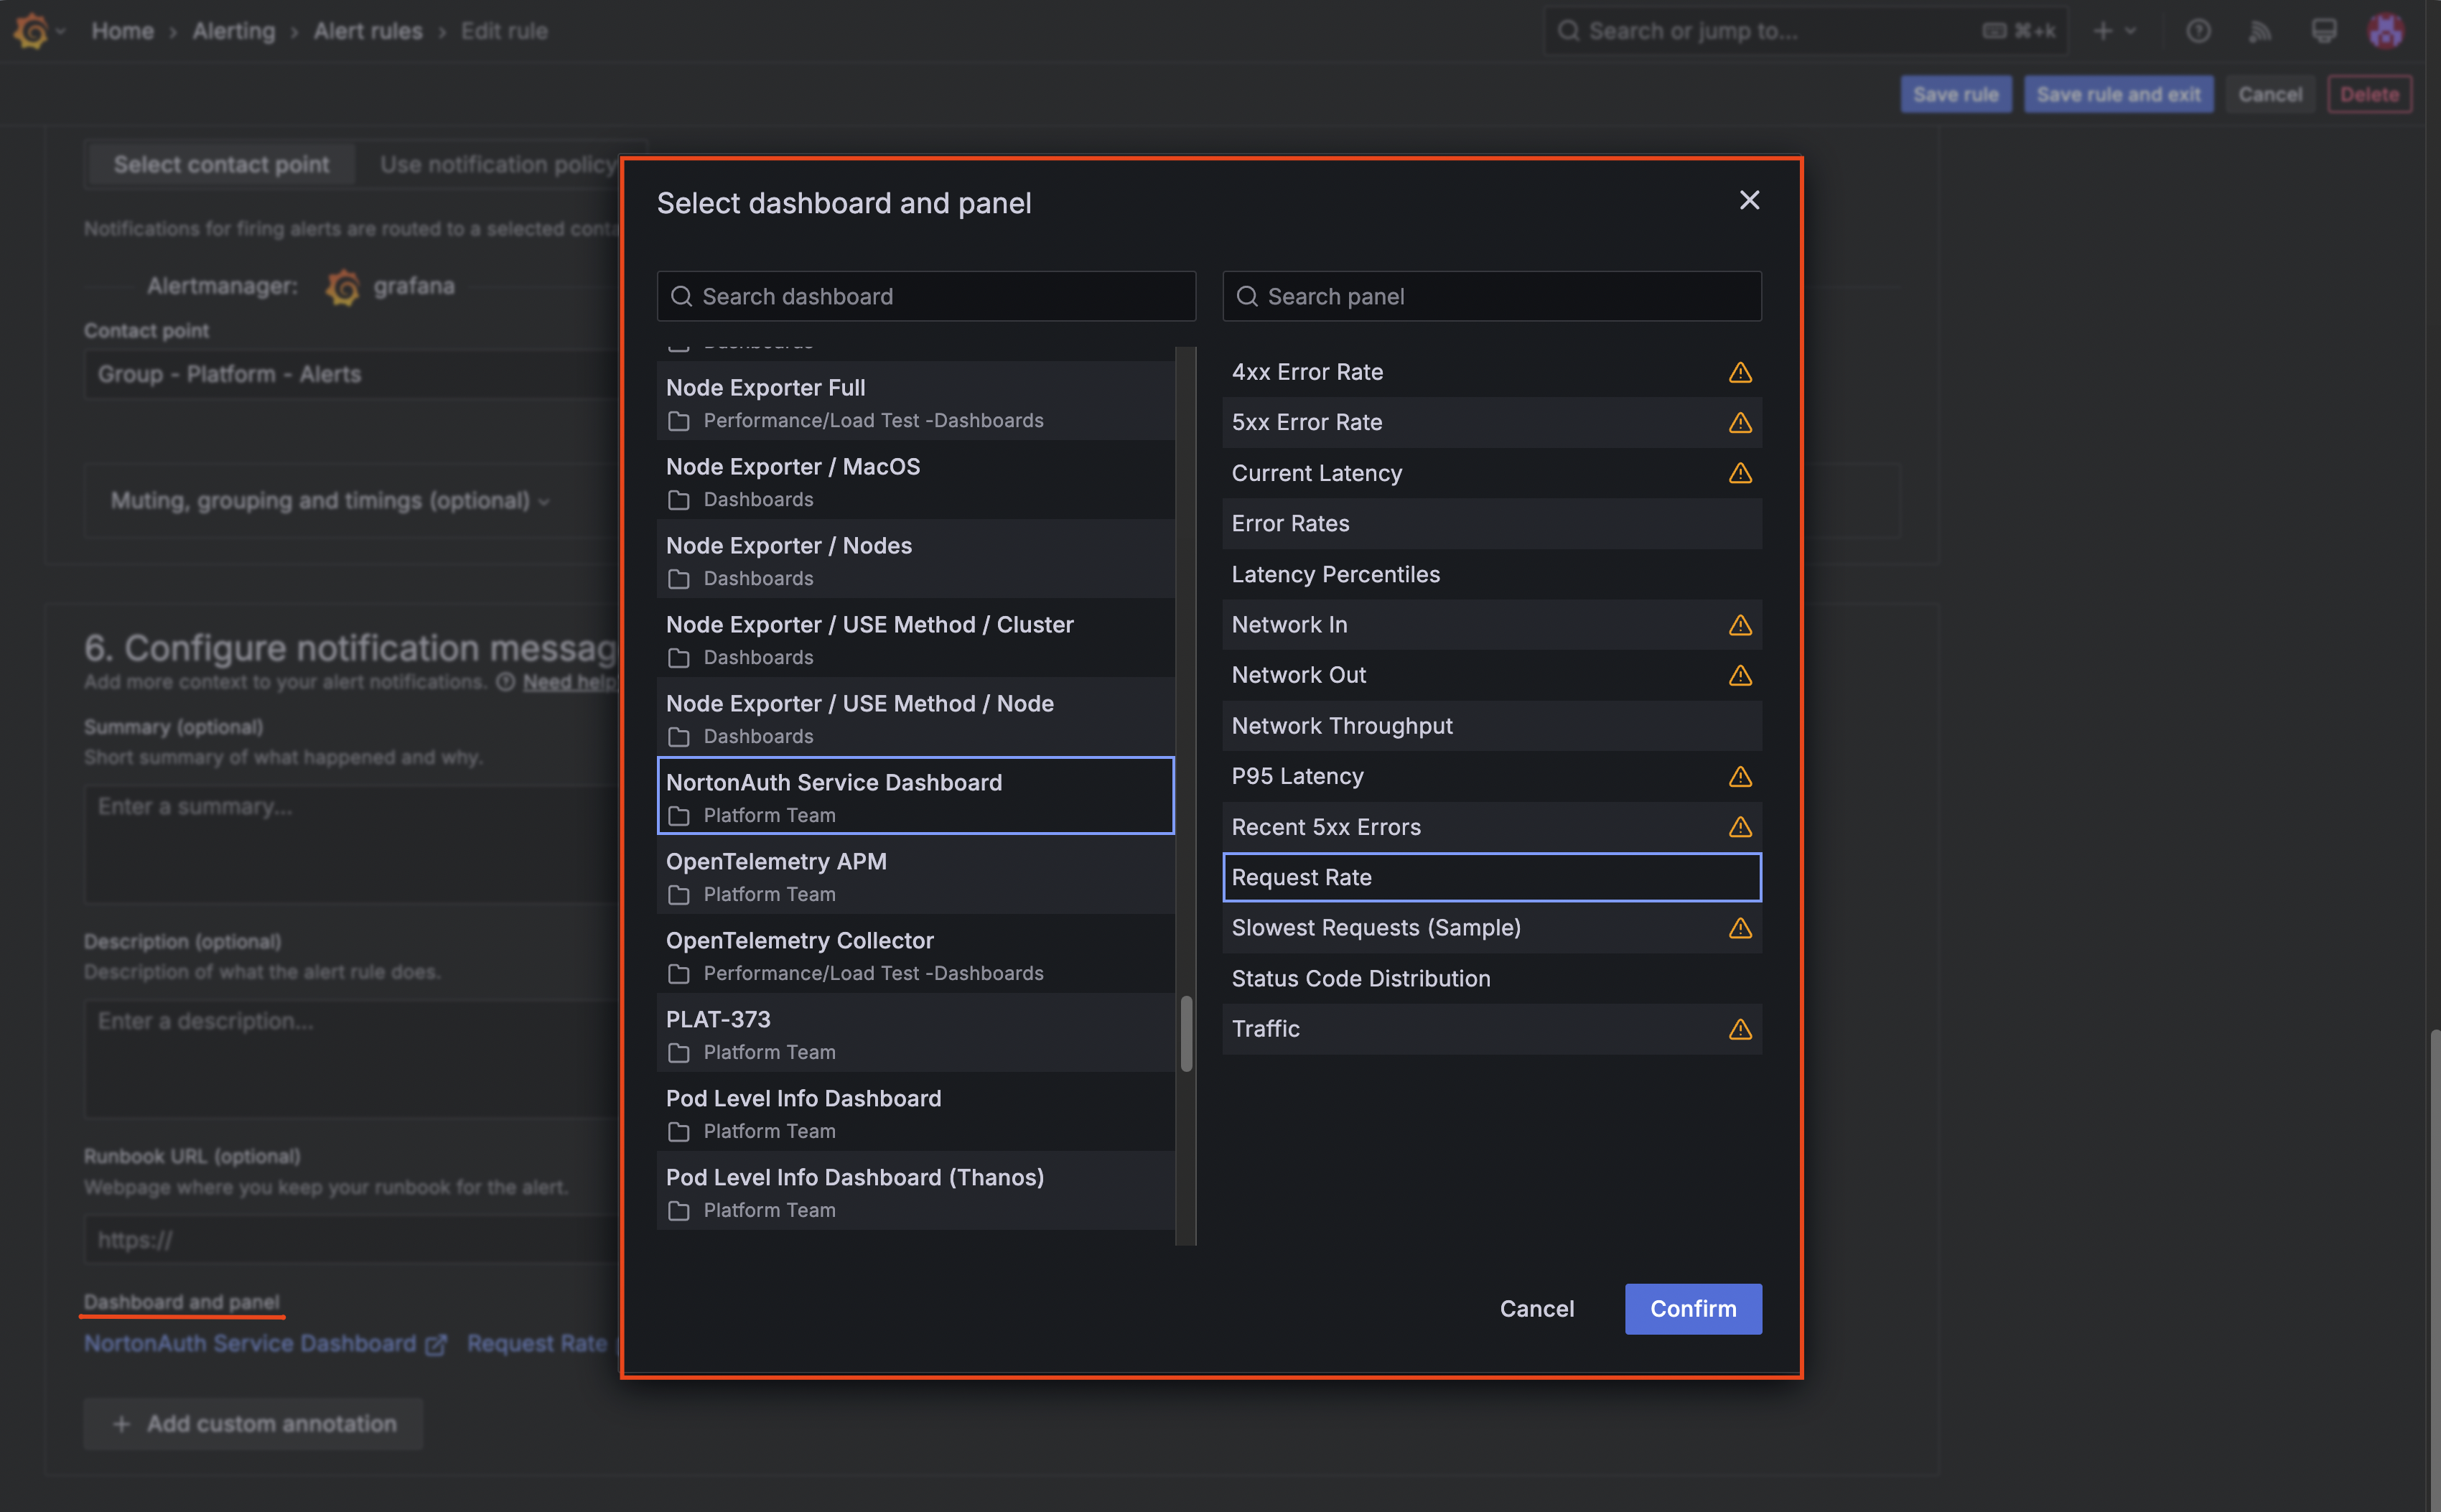
Step 6: Link Alerts to Dashboard Panels
For easier investigation, link each alert to its corresponding dashboard panel.
- Edit the alert rule
- In the Link dashboard and panel section:
- Select your service dashboard
- Select the relevant panel
- Save the rule
When the alert fires, the notification will include a direct link to the panel visualization.
Recommended Alert Set Summary
Here's a complete set of alerts for a typical service:
| Alert | Metric | Threshold | Pending | Severity |
|---|---|---|---|---|
| Service Down | rate == 0 | Equals 0 | 3m | Critical |
| Traffic Drop (Peak) | rate < baseline | Below threshold | 10m | Warning |
| Traffic Spike | rate > baseline + 3σ | Above threshold | 5m | Warning |
| P95 Warning | p95 > warning | Above threshold | 10m | Warning |
| P95 Critical | p95 > critical | Above threshold | 5m | Critical |
| P99 Elevated | p99 > threshold | Above threshold | 15m | Warning |
| 5xx Warning | error% > 1 | Above 1% | 10m | Warning |
| 5xx Critical | error% > 5 | Above 5% | 5m | Critical |
| 4xx Elevated | error% > 10 | Above 10% | 15m | Info |
Of course you can add more alerts to the dashboard if you want to, but these are the ones that we consider most important.
Validation and Testing
Before you call this done, verify everything works correctly.
Verify Dashboard Functionality
- Set the time range to "Last 24 hours"
- Confirm all panels display data
- Check that threshold colors appear correctly on graphs
- Test the variable dropdowns — switching environments should refresh data
Verify Alert Rules
- Navigate to Alerting → Alert rules
- Find your newly created rules
- Check that each shows status "Normal" or "Pending" (not "Error")
- Click into each rule and verify the preview shows reasonable values
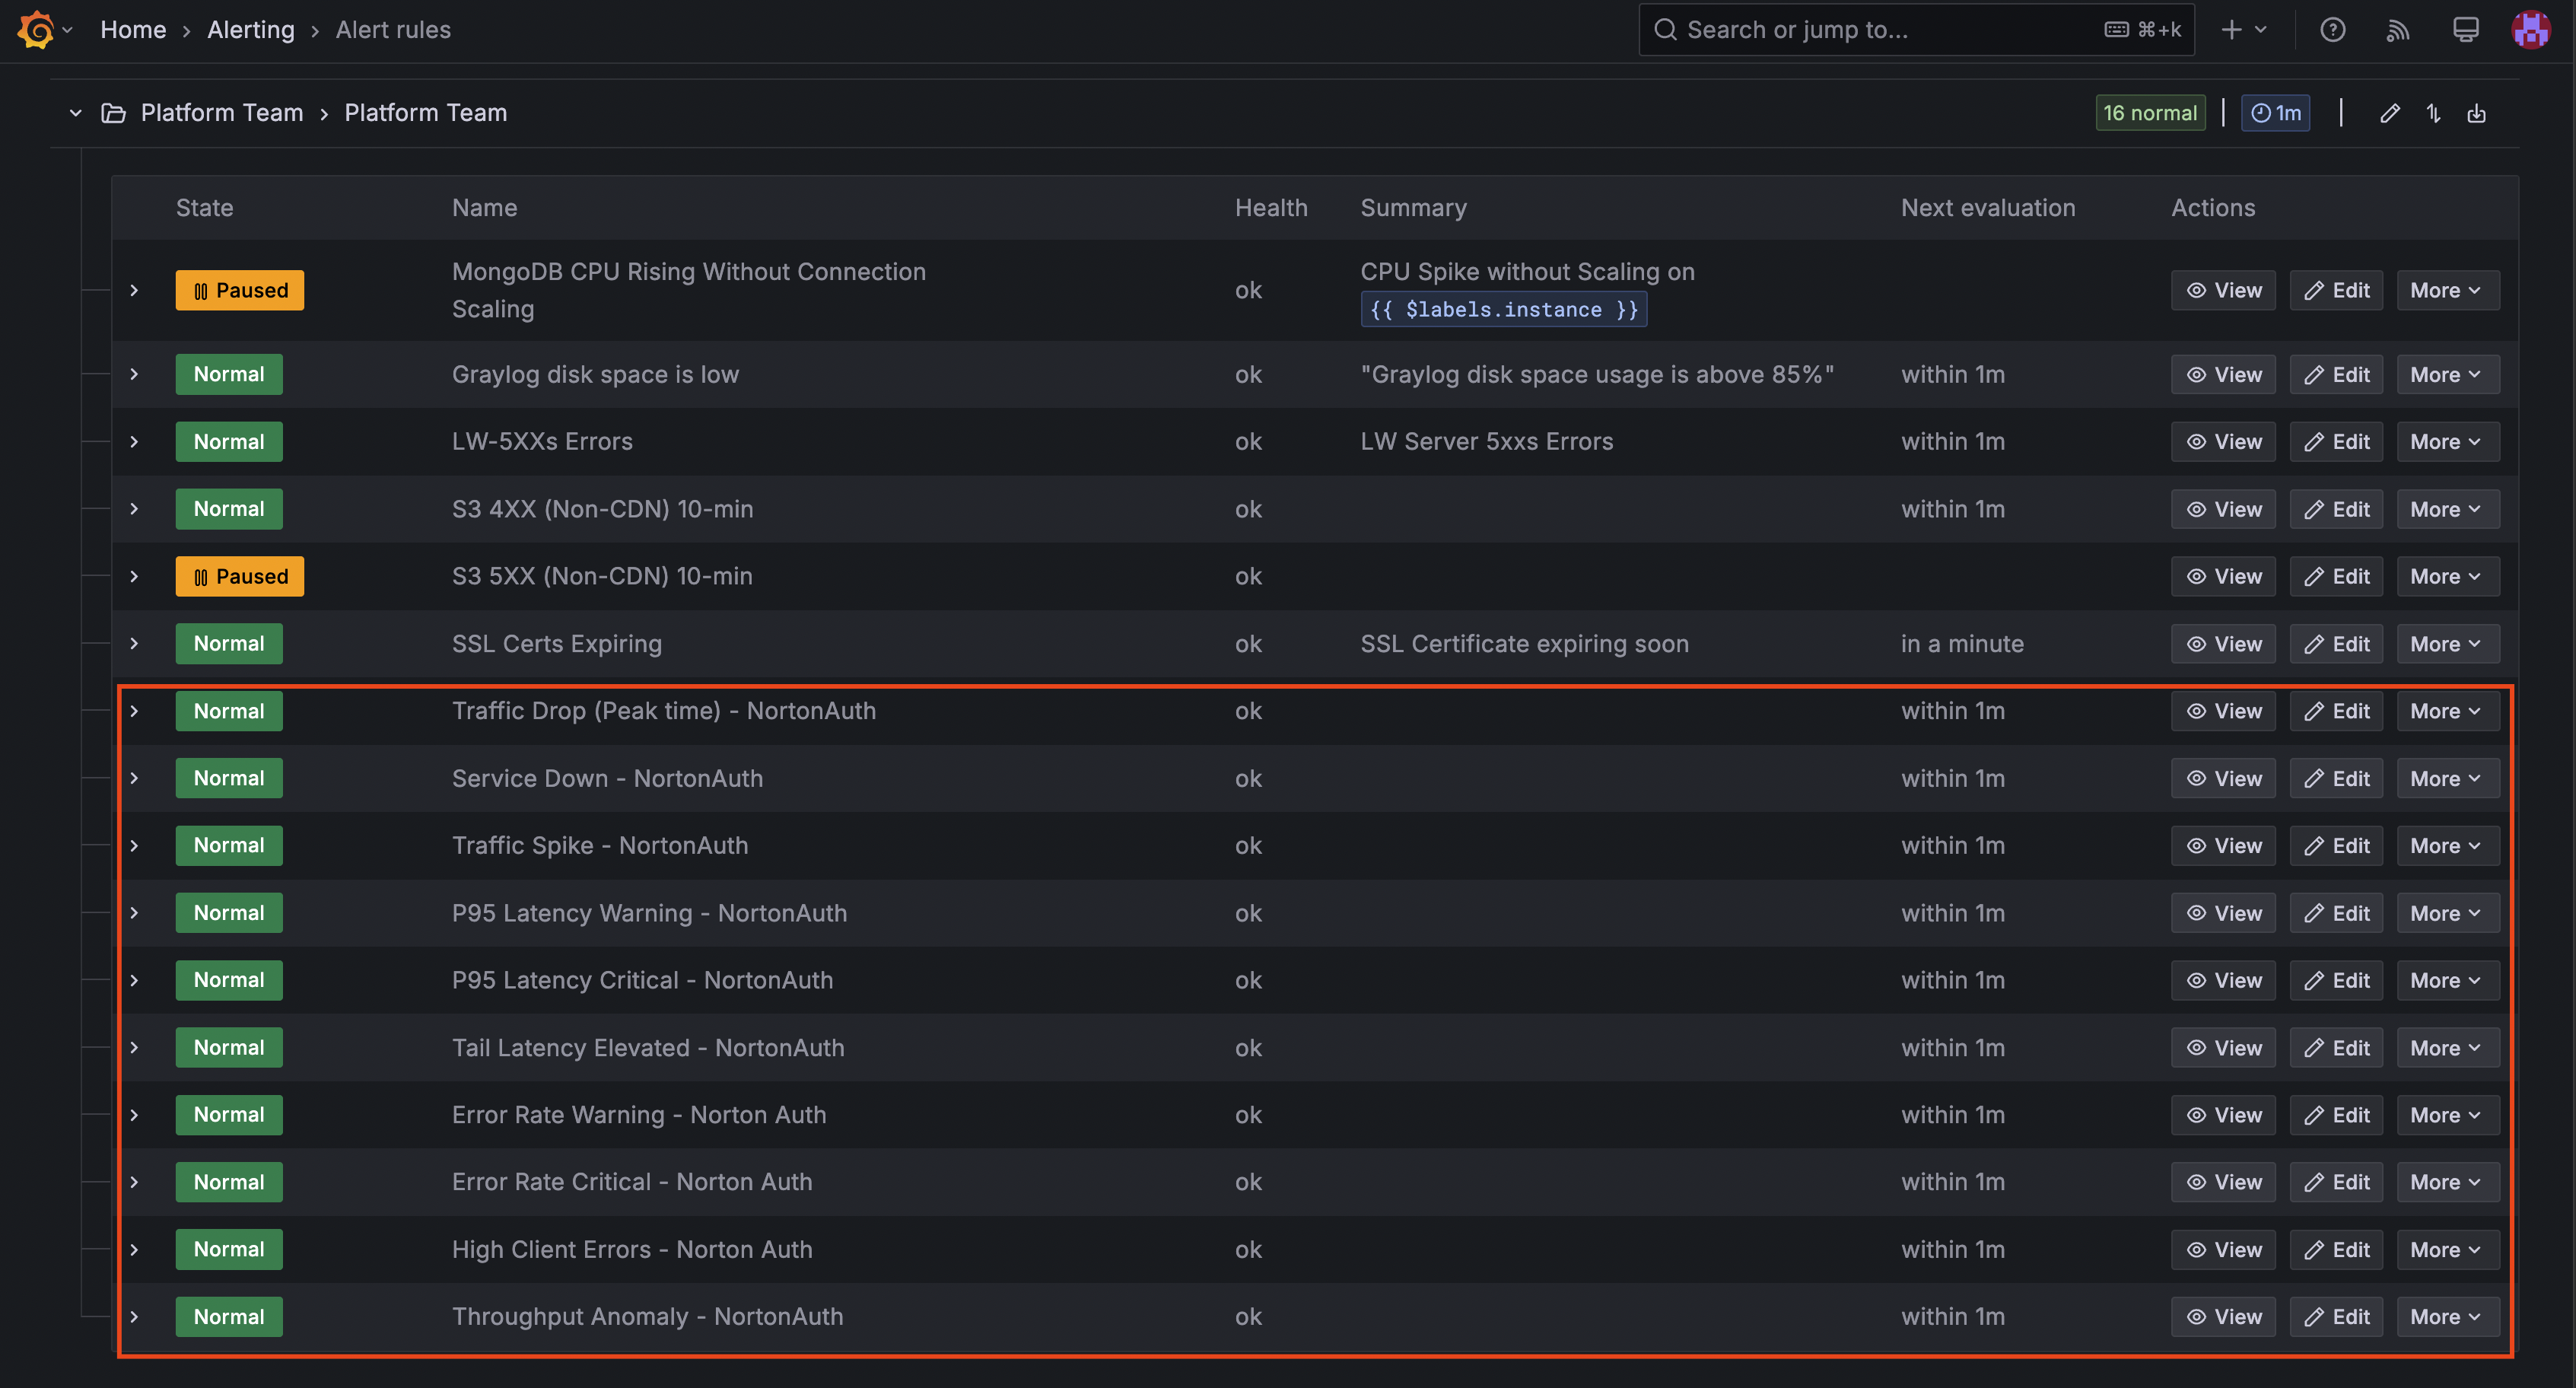
If an alert shows "Error" status, there's likely a syntax problem in your query or expression. Click into the rule, check the error message, and fix the issue before proceeding.
Test an Alert (Optional)
If you want to verify the notification pipeline works:
- Temporarily lower a threshold to trigger the alert
- Wait for the pending period to elapse
- Confirm you receive the notification
- Restore the original threshold
Troubleshooting
No Data in Dashboard Panels
Possible causes:
- Service variable doesn't match your target group pattern
- Environment variable doesn't match where your service runs
- Time range is outside Prometheus retention (older than ~30 days)
- Service genuinely has no traffic
To diagnose:
- Go to Explore
- Run the raw query with explicit filters
- Check if data exists for different time ranges
- Verify your service pattern against AWS target groups
Gaps in Data Visualization
For longer time ranges (7+ days), you might see gaps in the graph. This is expected behavior due to ALB log batching — see the explanation document for details.
Workarounds:
- Use the 5-minute rate metrics (
rate5m) instead of 1-minute for trend analysis - Enable "Connect null values" in the panel options
- Accept that some granularity is lost at longer time scales
Alert Shows "No Data"
Possible causes:
- Query returns no results (check your filters)
- Prometheus datasource is unreachable
- Metric doesn't exist for your service
To diagnose:
- Copy the query from the alert rule
- Run it in Explore
- If no data, debug the query
- If data exists, check the datasource UID in the alert matches Explore
Alert Never Fires
Possible causes:
- Threshold is set too high (or too low for "below" conditions)
- Pending period is longer than the anomaly duration
- Time-based filters exclude the time when issues occur
To diagnose:
- Look at the alert rule's evaluation history
- Compare actual metric values against your threshold
- Check if the condition was met but resolved before pending period elapsed
Alert Fires Too Often
Possible causes:
- Threshold is too aggressive
- Pending period is too short
- Normal traffic patterns weren't accounted for
To fix:
- Re-analyze baselines with a longer time range
- Increase thresholds (mean + 3σ instead of mean + 2σ)
- Lengthen pending periods
- Add time-of-day filters for known low-traffic periods
Maintenance
Baselines aren't set-and-forget. Services change over time.
Quarterly Review
Every 3 months (or after significant service changes):
- Re-run baseline analysis with fresh data
- Compare new baselines against current thresholds
- Adjust thresholds if patterns have shifted
- Document changes
After Major Changes
If your service undergoes significant changes (new features, traffic shifts, architecture changes):
- Wait 1-2 weeks for new patterns to stabilize
- Re-analyze baselines
- Update thresholds accordingly
Alert Hygiene
Periodically review your alert history:
- Are there alerts that fire frequently but don't indicate real problems? Tune them.
- Are there incidents that weren't caught by alerts? Add coverage.
- Are alert descriptions still accurate? Update them.
Quick Reference
Metrics Available
| Metric | Description |
|---|---|
alb:requests:rate1m | Request rate (1-min window) |
alb:requests:rate5m | Request rate (5-min window, smoother) |
alb:latency:p50 | Median response time |
alb:latency:p95 | 95th percentile response time |
alb:latency:p99 | 99th percentile response time |
alb:error_rate_5xx:percent | Server error percentage |
alb:error_rate_4xx:percent | Client error percentage |
alb:bytes_sent:rate1m | Outbound throughput |
alb:bytes_received:rate1m | Inbound throughput |
For complete details on each metric, see the Explanation Document.
Useful PromQL Patterns
Filter by service and environment:
alb:requests:rate1m{service=~".*YOUR_SERVICE.*", environment="prod"}
Business hours only:
your_metric and hour() >= 9 and hour() < 18 and day_of_week() != 0 and day_of_week() != 6
Average over time range:
avg_over_time(alb:latency:p95{service=~".*YOUR_SERVICE.*"}[$__range])
Standard deviation over time range:
stddev_over_time(alb:latency:p95{service=~".*YOUR_SERVICE.*"}[$__range])
Dashboard Links
- Service Pattern Discovery (Fast)
- Service Pattern Discovery (Slow)
- Service Dashboard Template
- RDS Database Template
Getting Help
If you run into issues or have questions:
- Check the Explanation Document for conceptual clarification
- Review the NortonAuth alerts in the Platform Team folder as a working example
- Submit a request to Platform Team via JIRA for hands-on assistance